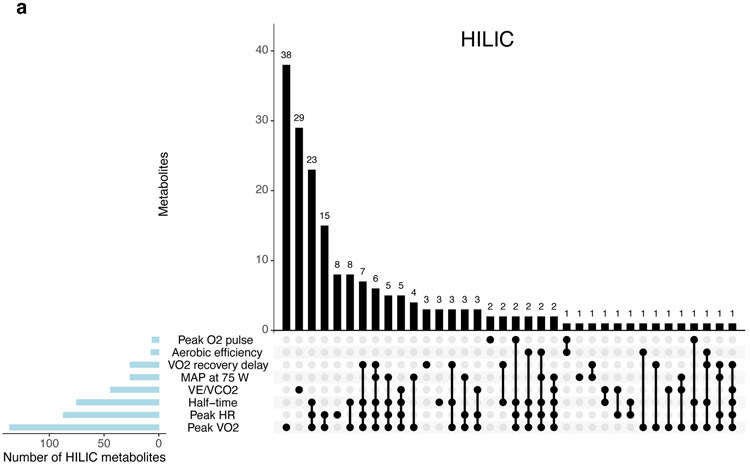
Figure 3. Resting metabolite profiles are differentially associated with multi-dimensional physiologic measurements during exercise.
Panels (A-C) display the number of resting metabolite levels (per platform, in columns) that are significantly associated (at a 5% FDR) with combinations of CPET measures (in rows) in age- and sex-adjusted linear regression models. Panel (D) displays the estimated regression coefficients for select metabolites in regressions for three key physiological exercise responses: peak VO2, VE/VCO2 nadir, and MAP at 75 watts. Each CPET variable demonstrates a pattern of associations with metabolites representing distinct physiologic processes as noted. Details of metabolite functions and associations with cardiometabolic traits are shown in Table 4. Asterisks are used to denote statistical significance as follows: * = FDR >0.01 to ≤0.05; ** = FDR >0.001 to ≤0.01; *** = FDR ≤0.001. Raw data for these plots are shown in Table VII-IX in the Supplement.
Abbreviations: NO, nitric oxide


