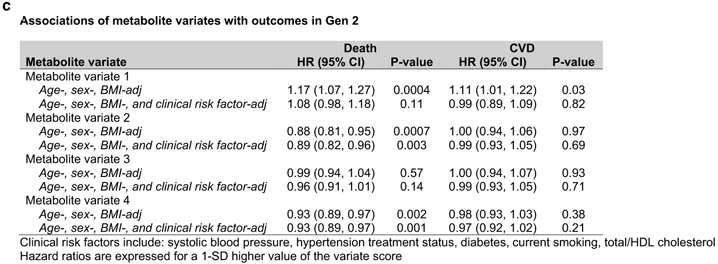
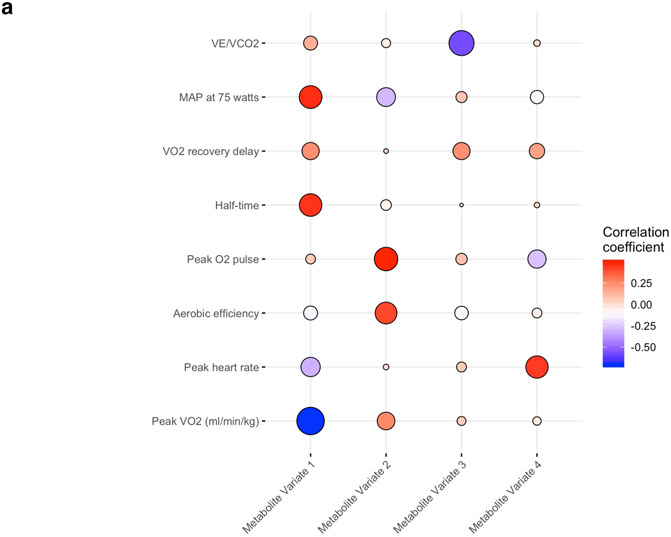
Figure 4. Correlations of metabolites with integrated exercise responses.

Panel (A) shows the age- and sex-adjusted partial correlations of each exercise measure with metabolite variates determined by canonical correlation analysis. The size of each circle is proportional to the absolute value of the correlation coefficient, and its color represents the directionality of correlation. Panel (B) represents a heatmap of the age- and sex-adjusted partial correlations of metabolites with metabolite variates. The metabolites shown here have a correlation coefficient ≥0.25 with any of the metabolite variates. Panel (C) displays the multivariable-adjusted associations of the four metabolite variates with death and incident CVD.


