
Figure 2. Rod-Mediated Light Responses in AON-S Ganglion Cells Have Partially Recovered Excitatory Currents and Spike Output.
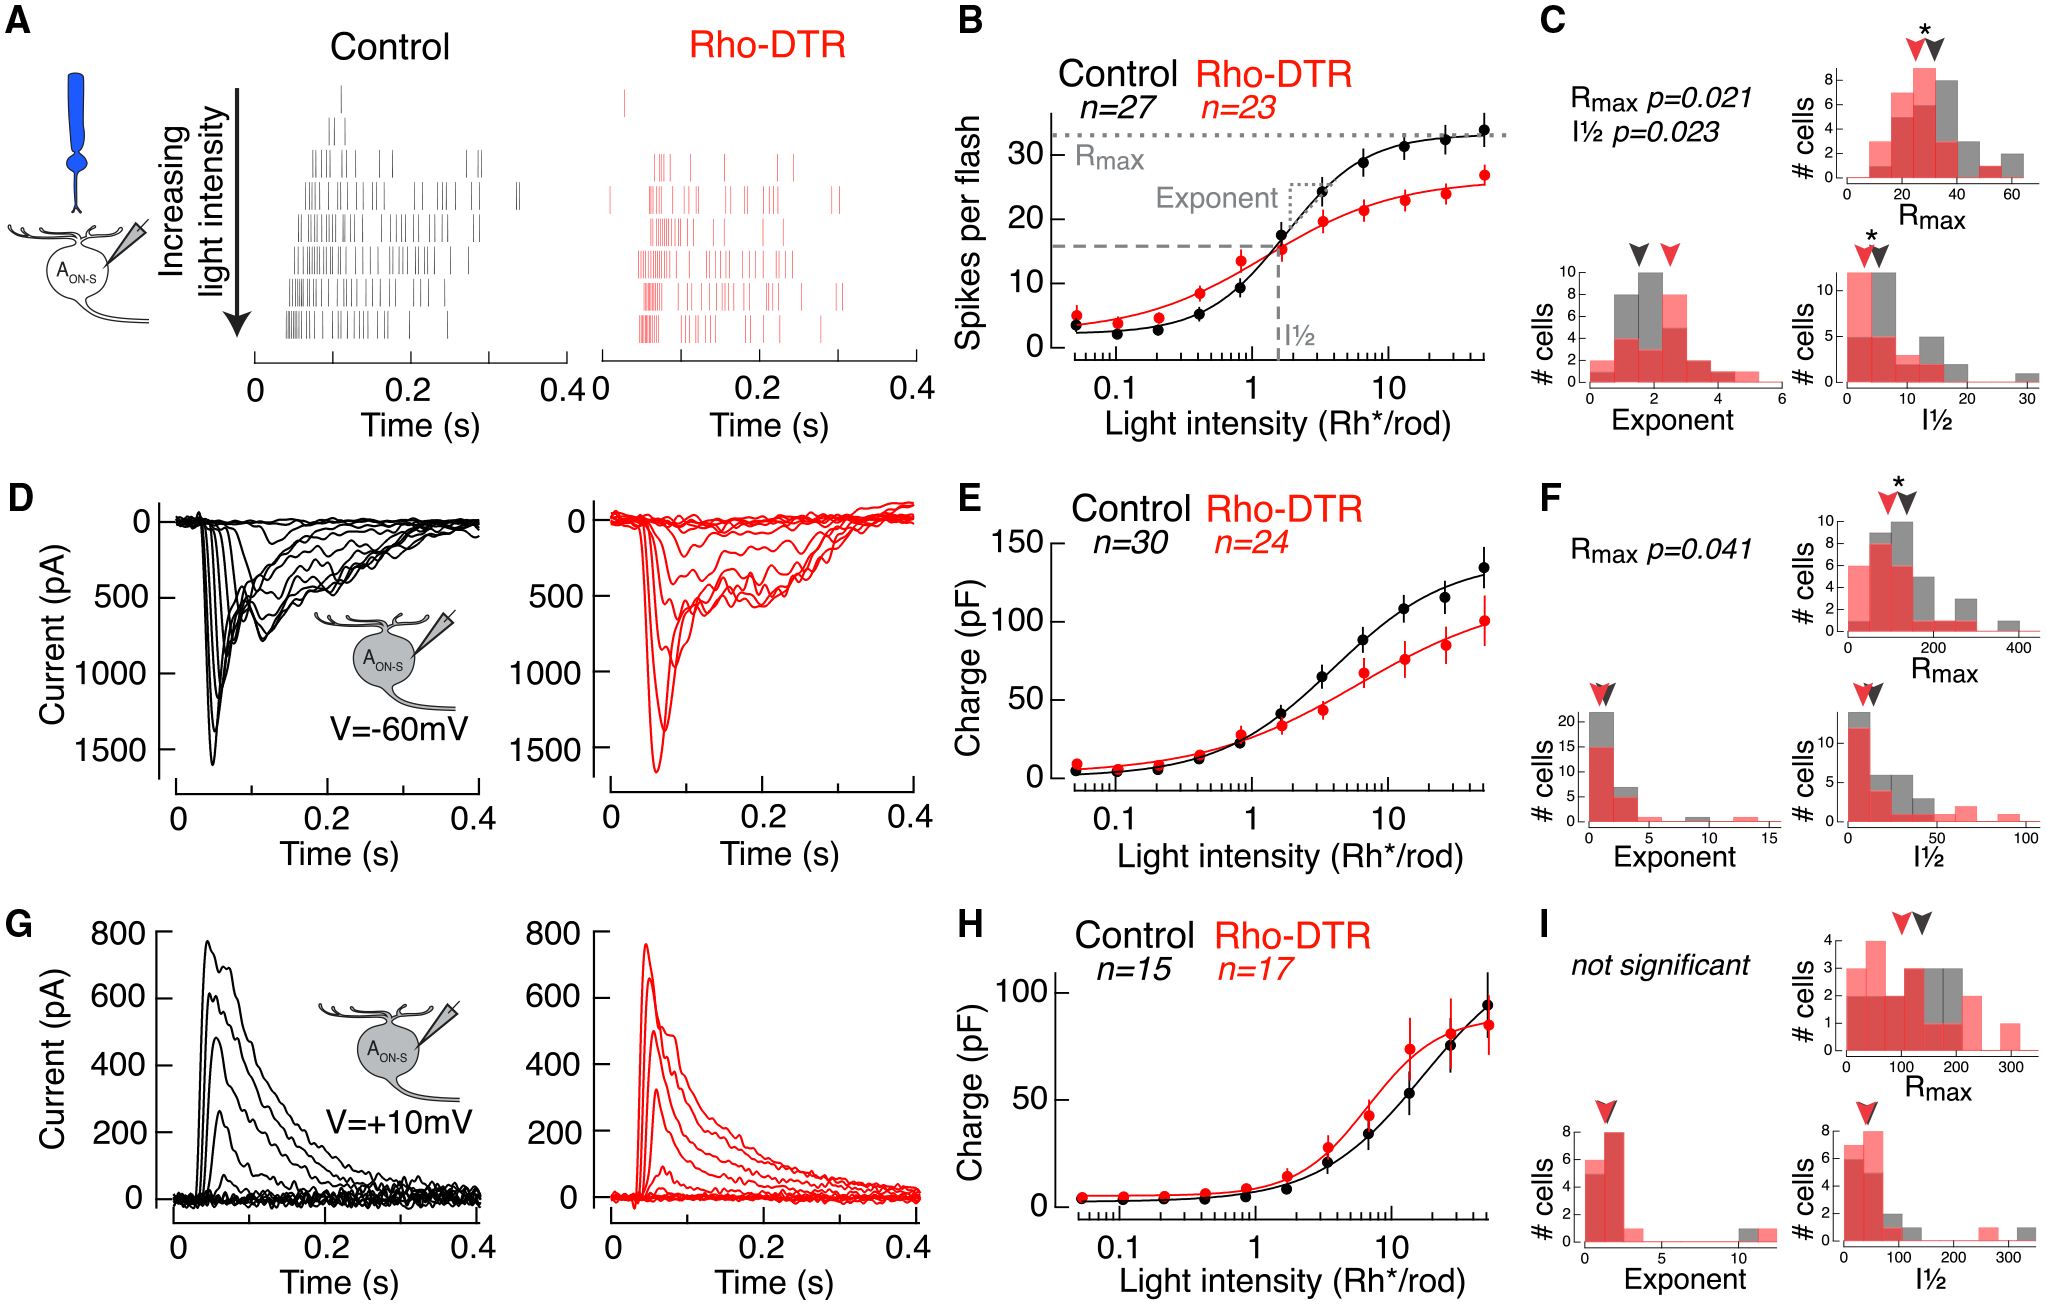
(A) Spike rasters from cell-attached recordings of AON-S ganglion cells in response to a rod-preferring stimulus: 10-ms flash at time 0 with the 470-nm LED on a dark background. Each row shows the response to a flash doubling in intensity from top to bottom in control (black) and Rho-DTR (red) conditions.
(B) Average intensity-response relationship for the total number of spikes in response to each flash intensity. Points are mean ± SEM, n is number of cells. (B, E, and H) Data points fit with a Hill equation, which can be captured by a maximum response (Rmax), intensity at half maximum response (I½), and exponent.
(C) Histogram of three fit parameters for the population of AON-S ganglion cells in control and Rho-DTR conditions. (C, F, and I) Triangles above represent the median of each distribution, and asterisks denote significant differences between control and Rho-DTR populations by the rank sum test. Significant p values are reported in the upper left corner.
(D) Excitatory currents from voltage-clamp recordings of AON-S ganglion cells (V = −60 mV) in response to the same rod-mediated stimulus described above.
(E) Intensity-response relationship for the integral of the excitatory current.
(F) As described above for fits to the excitatory charge for individual cells.
(G) Inhibitory currents from voltage-clamp recordings of AON-S ganglion cells (V = +10 to +60 mV, determined by reversal of the light response) in response to the same rod-mediated stimulus described above.
(H) Intensity-response relationship for the integral of the inhibitory current.
(I) As described above for fits to the inhibitory charge for individual cells.