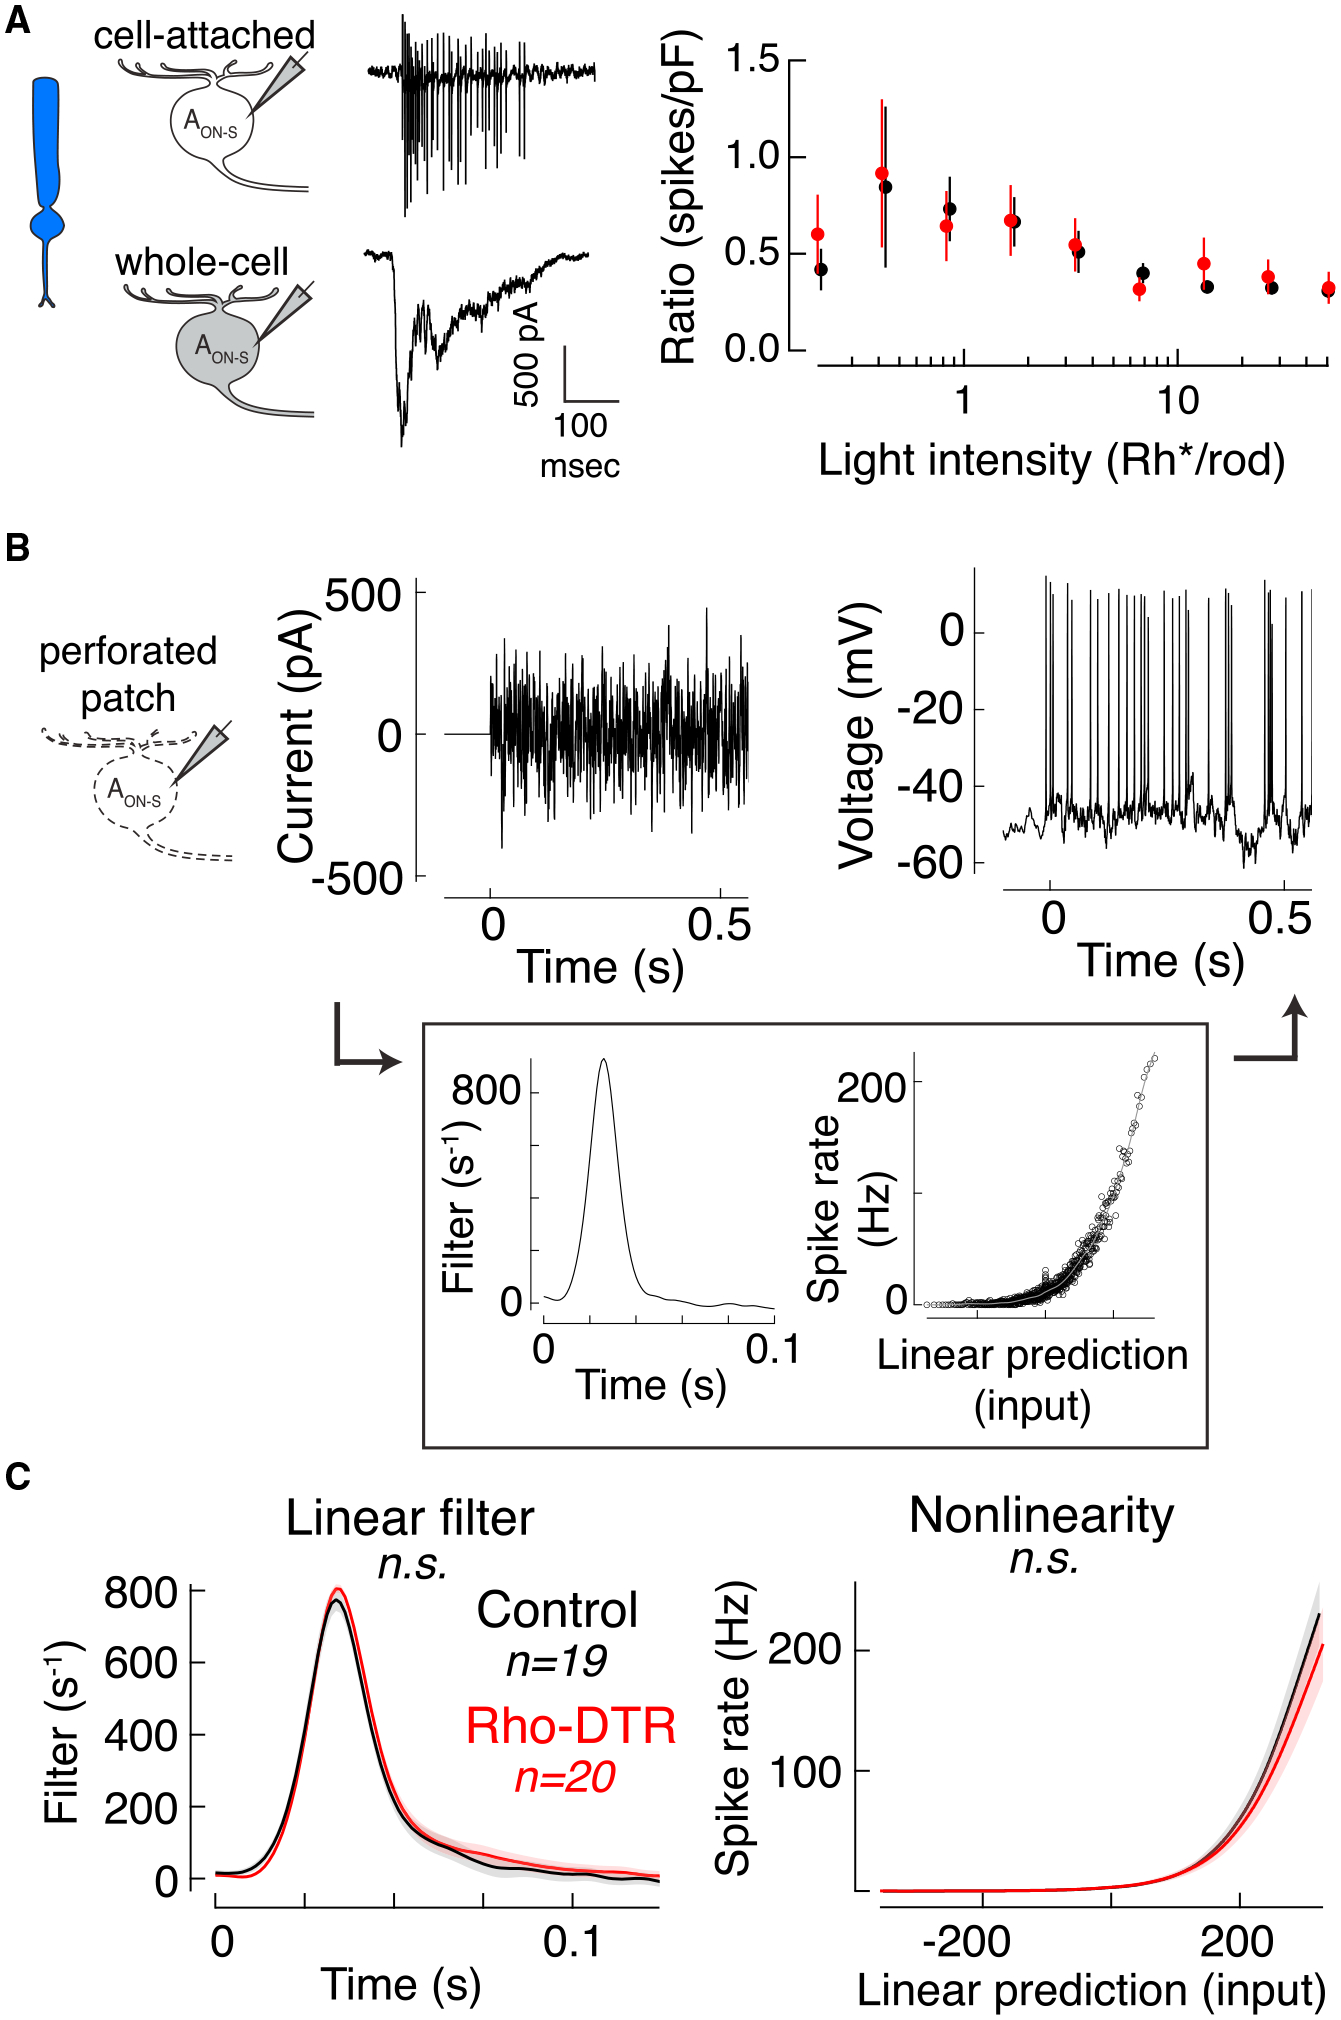
Figure 3. Intrinsic Excitability of AON-S Ganglion Cells Is Maintained at Rod Light Levels after Rod Loss.

(A) Cartoons and example traces of the recordings used (left) in the calculation of the ratio of rod-mediated spike count to charge for each AON-S ganglion cell in which both measurements were made sequentially in the same cell (right). Points are mean ± SEM.
(B) Test of intrinsic excitability. Example of current injected through the patch pipette (left) and the resulting spikes (right) recorded in perforated patch configuration. Background was kept dark during the duration of the current injections, which were 40-s epochs for six or more repeats. (Box) Time-reversed spike-triggered average (left in box) and the nonlinearity for the example cell (right in box). Nonlinearity fit with a sigmoid function (gray).
(C) Time-reversed spike-triggered average (left) and average nonlinearity (right) of the linear-nonlinear model calculated from spike responses to white noise current injections (mean ± SEM). For the nonlinearity, abscissa represents the convolution between the spike-triggered average and the stimulus in units of standard deviation, i.e., linear prediction or generator potential. Ordinate represents the spike rate. The nonlinearity for each cell was interpolated and smoothed with a spline function. Permutation test shows that neither the linear filter nor nonlinearity are significantly different between control and Rho-DTR conditions.
