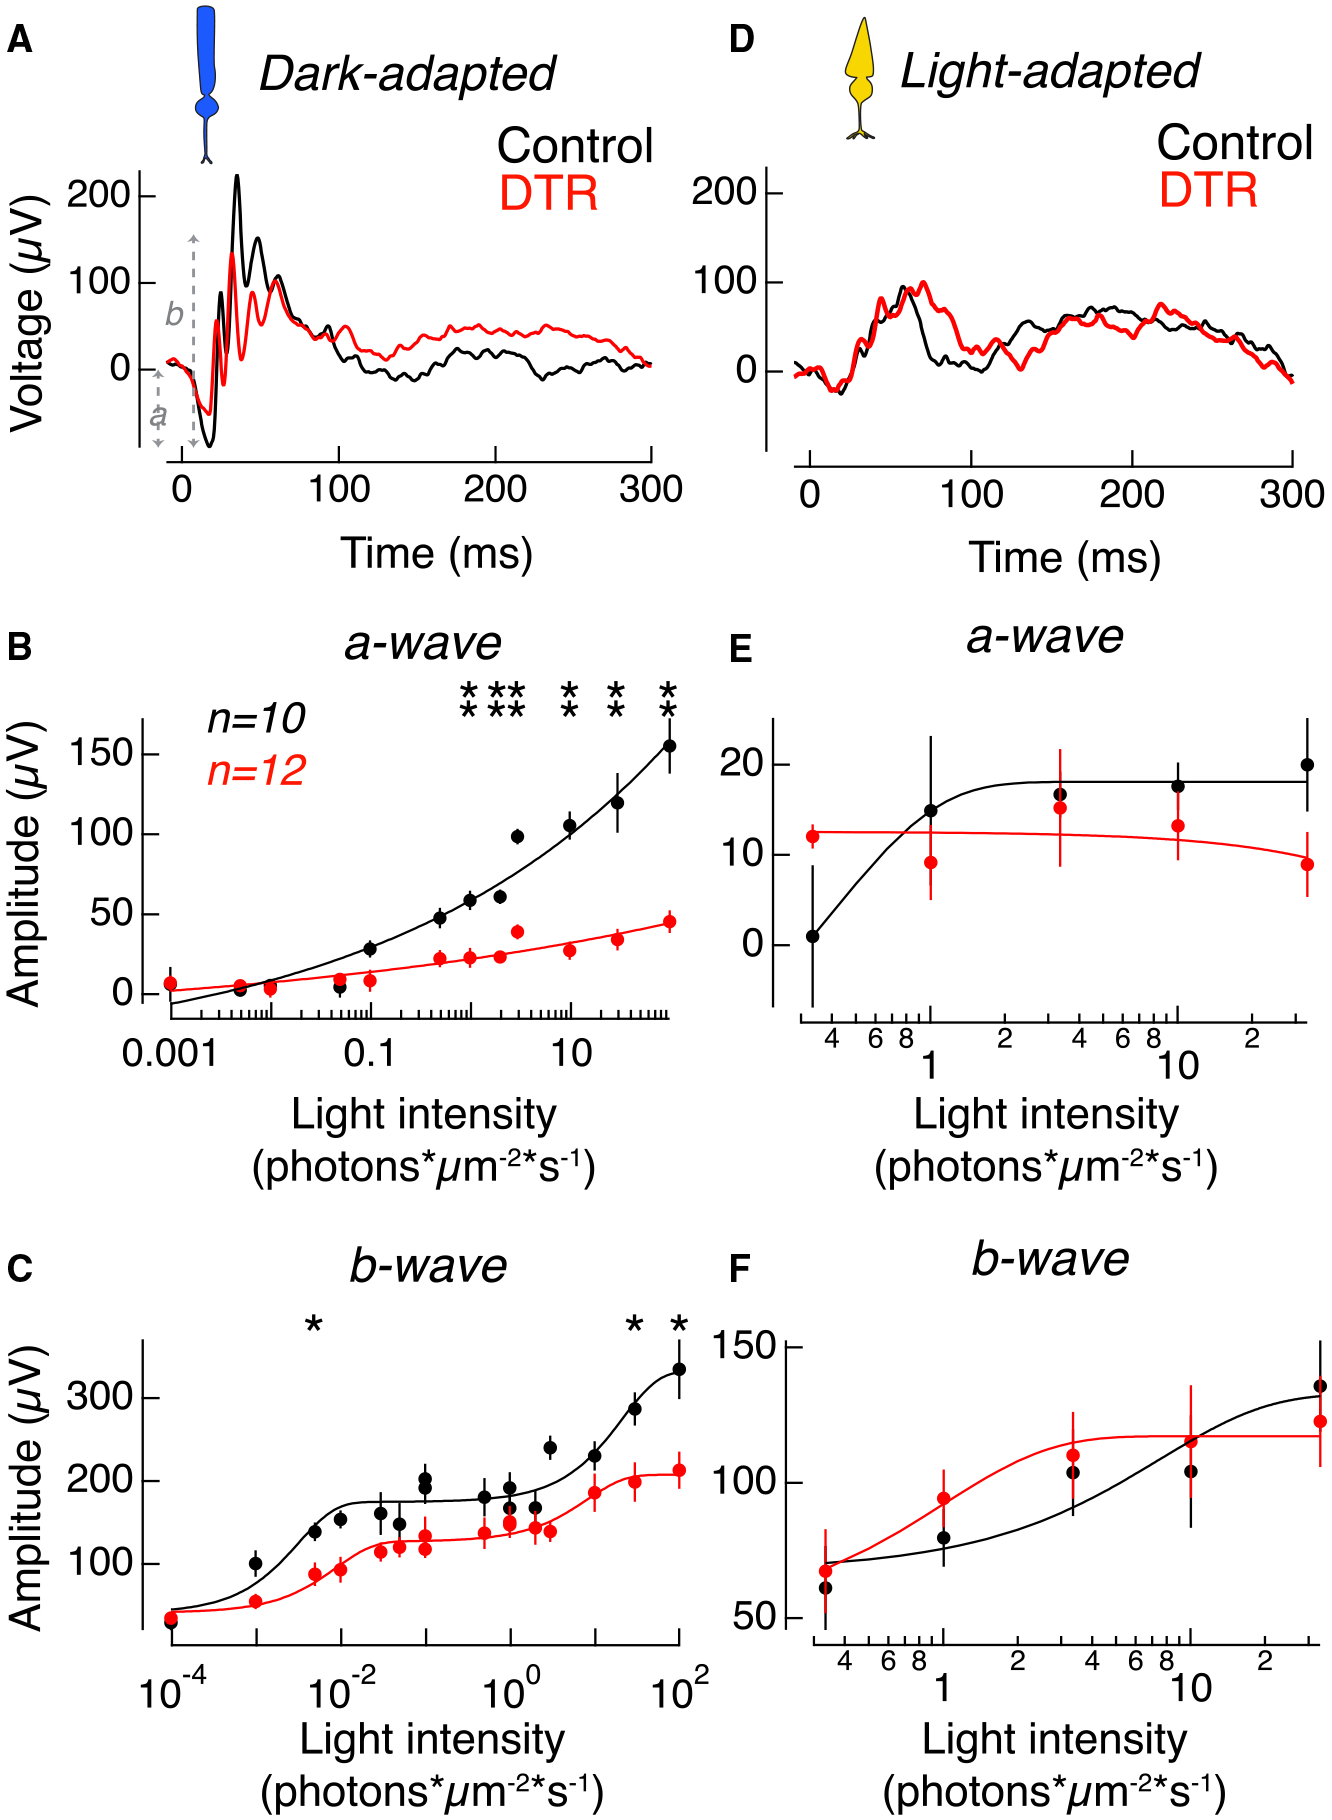
Figure 4. Rod-Mediated Responses Compromised but Postsynaptic and Cone-Mediated Responses Preserved in the Electroretinogram.

(A) Example in vivo electroretinogram of control (black) and Rho-DTR (red) mice taken in the dark-adapted, rod-mediated condition at 2.919 photons*μm−2*s−1. Amplitude of a-wave was measured from baseline to the trough of the first negative peak. Amplitude of b-wave was measured from the trough of the first negative peak to the second-highest positive peak.
(B) Average amplitude of the dark-adapted a-wave, which is the rod-mediated voltage response in the waveform, as a function of light intensity. Points are mean ± SEM. Significant differences between response amplitudes at each light intensity are denoted by asterisks above each pair of points (t test). Light intensities (p value); 0.973 photons*μm−2*s−1 (0.030); 1.946 (0.0173); 2.919 (0.0043); 9.73 (0.0043); 29.19 (0.0087); and 97.3 (0.0043).
(C) Average amplitude of the dark-adapted b-wave, which is the rod bipolar cell-mediated voltage response in the waveform, as a function of light intensity. Points are mean ± SEM. Light intensity (p value); 0.04865 photons*μm−2*s−1 (0.030); 29.29 (0.017); and 97.3 (0.030).
(D) Example in vivo electroretinogram of control (black) and Rho-DTR (red) mice taken in the light-adapted, cone-mediated condition.
(E) Average amplitude of the light-adapted a-wave, which is the cone-mediated voltage response in the waveform, as a function of light intensity. Points are mean ± SEM. No significant differences across light intensities (t test).
(F) Average amplitude of the light-adapted b-wave, which is the ON cone bipolar cell-mediated voltage response in the waveform, as a function of light intensity. Points are mean ± SEM. No significant differences across light intensities (t test). Electroretinograms taken 1 month after DT injection. Electroretinograms taken 3 days and ≥4 months after DT injection shown in Figure S6.
