
Figure 6. Cone-Mediated Spiking and Input Currents in AON-S Ganglion Cells Increase after Rod Loss.
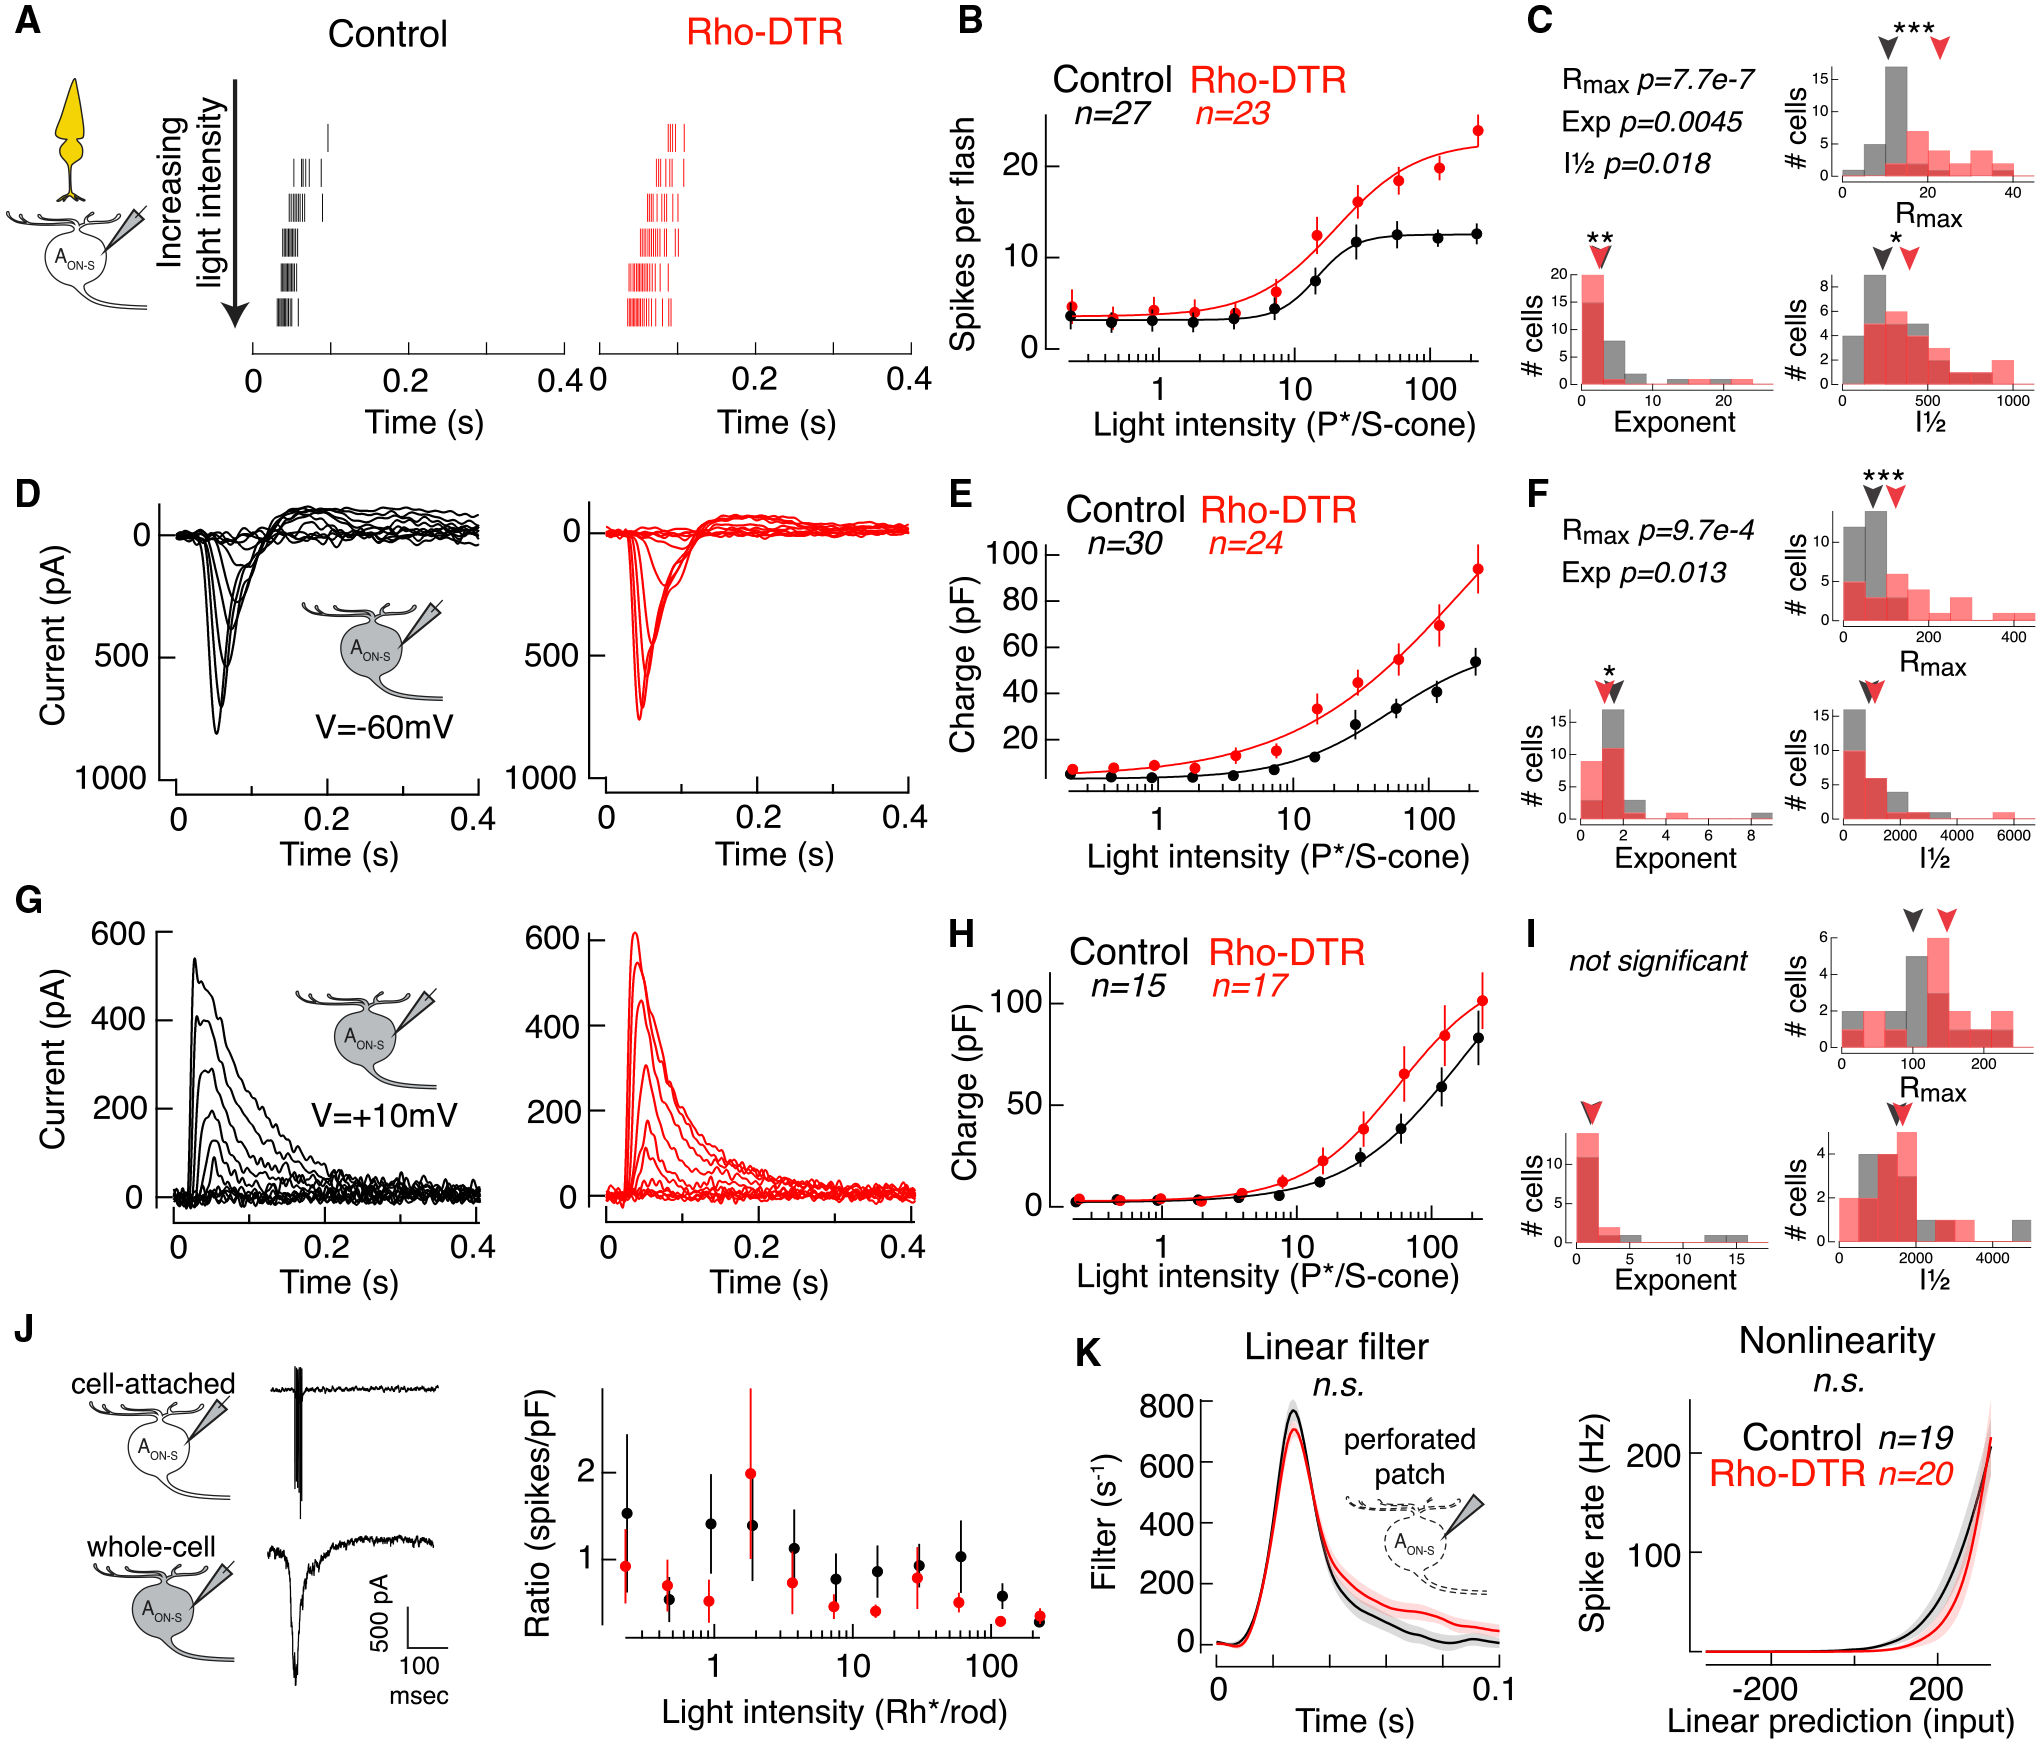
(A) Spike rasters from cell-attached recordings of AON-S ganglion cells in response to a cone-preferring stimulus: 10-ms flash at time 0 with the 370-nm LED on a mean of 4,000 Rh*/rod/s produced by the 470-nm LED to adapt rods. Each row shows the response to a flash doubling in intensity from top to bottom in control (black) and Rho-DTR (red) conditions.
(B) Average intensity-response relationship for the total number of spikes in response to each flash intensity. Points are mean ± SEM. (B, E, and H) Data points for each cell fit with a Hill equation, which can be captured by a maximum response (Rmax), intensity at half maximum response (I½), and exponent.
(C) Histogram of fit parameters for the population of AON-S ganglion cells in control and Rho-DTR conditions. (C, F, and I) Triangles above represent the median of each distribution, and asterisks denote significant differences between control and Rho-DTR populations by the rank sum test. Significant p values are reported in the upper left corner.
(D) Excitatory currents from voltage-clamp recordings of AON-S ganglion cells (V = −60 mV) in response to the same cone-mediated stimulus described above.
(E) Intensity-response relationship for the integral of the excitatory current.
(F) Histogram of Hill equation fits to the excitatory charge for individual cells.
(G) Inhibitory currents from voltage-clamp recordings of AON-S ganglion cells (V = +10 to +60 mV, determined by reversal of the light response) in response to the same cone-mediated stimulus described above.
(H) Intensity-response relationship for the integral of the inhibitory current.
(I) Histogram of Hill equation fits to the inhibitory charge for individual cells.
(J) Cartoons and example traces of the recordings used (left) in the calculation of the ratio of cone-mediated spike count to charge calculated for each AON-S ganglion cell in which both measurements were made in the same cell (right). Points are mean ± SEM.
(K) Time-reversed spike-triggered average (left) and average nonlinearity (right) of the linear-nonlinear model calculated from spike responses to white noise current injections (mean ± SEM) in perforated patch configuration. Blue mean of 4,000 Rh*/rod/s was applied to adapt rods for the duration of the current injections. For the nonlinearity, abscissa represents the convolution between the spike-triggered average and the stimulus in units of standard deviation, i.e., linear prediction or generator potential. Ordinate represents the spike rate. The nonlinearity for each cell was interpolated and smoothed with a spline function. Permutation test shows that neither the linear filter nor nonlinearity are significantly different between control and Rho-DTR conditions.
See also Table S5.