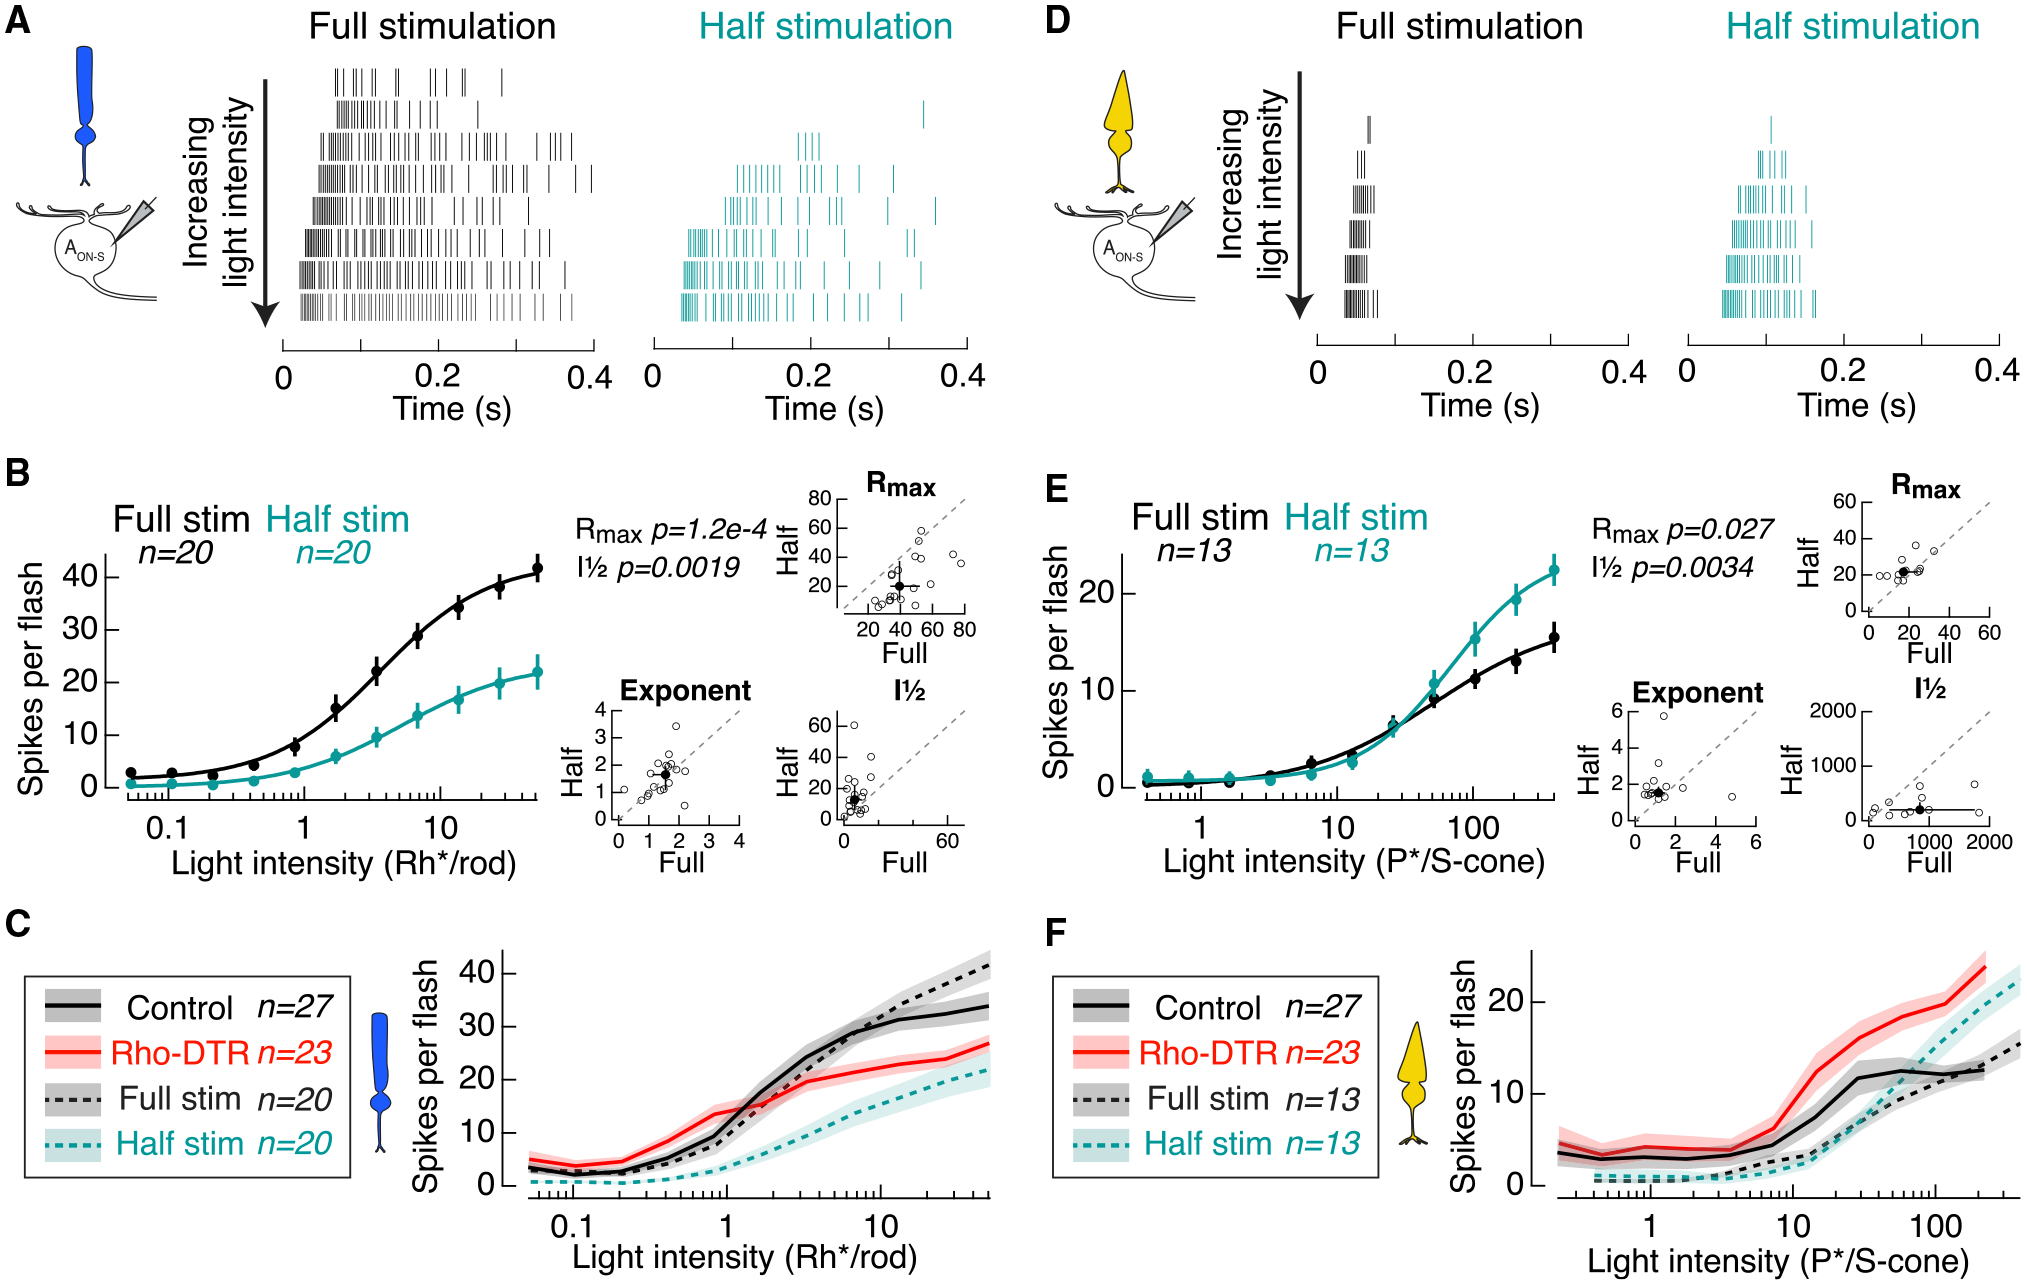
Figure 7. Half Stimulation of Control Retina Replicates Cone-but Not Rod-Mediated Responses in Rho-DTR Retina.

(A) Spike rasters from cell-attached recordings of AON-S ganglion cells in response to the rod-preferring stimulus. Each row shows the response to a flash doubling in intensity from top to bottom in full-stimulation (black) and half-stimulation (teal) conditions.
(B) Left: average intensity-response relationship for the total number of spikes in response to each flash intensity. Points are mean ± SEM. (B and E) Data points for each cell fit with a Hill equation, which can be captured by a maximum response (Rmax), intensity at half maximum response (I½), and exponent. Right: fit parameters for which responses to both full and half stimulation were recorded in the same cell. Individual cells (open circles) and median ± IQR (closed circles with error bars). Dotted line indicates the line of slope unity. Significant p values by the Wilcoxon sign rank test reported in the upper left corner.
(C) Comparison of rod-mediated spike response from AON-S ganglion cells from control retina (Control), control retina with full stimulation (Full stim), control retina with half stimulation (Half stim), and Rho-DTR retina indicates that Rho-DTR responses are partially recovered with respect to cells receiving half stimulation. “Control” and “Full stim” are both control retinas stimulated with full stimuli but acquired as separate control datasets. Lines and shaded regions are mean ± SEM.
(D) Spike rasters from cell-attached recordings of AON-S ganglion cells in response to the cone-preferring stimulus. Each row shows the response to a flash doubling in intensity from top to bottom in full-stimulation (black) and half-stimulation (teal) conditions.
(E) Left: average intensity-response relationship for the total number of spikes in response to each flash. Right: fit parameters for which responses to both full and half stimulation were recorded in the same cell.
(F) Comparison of cone-mediated spike response from AON-S ganglion cells as described in (C).
See also Table S6.
