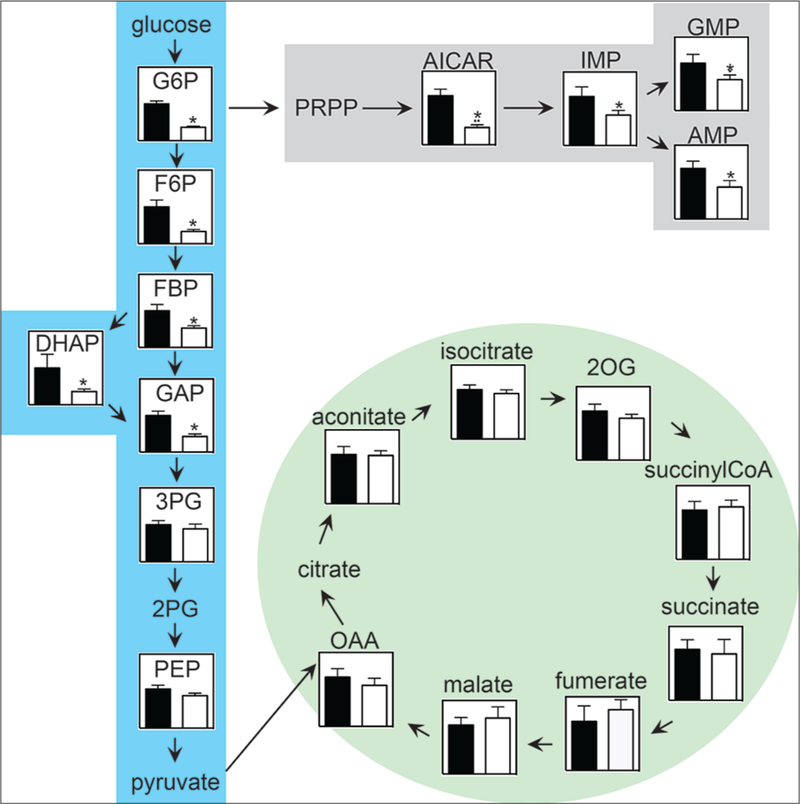
Figure 2:
Overexpression of Snail alters the fluctuations of the metabolites on the central metabolic pathways in A549 cells. A549‑Snail cells were grown in the absence (black bars) or presence (white bars) of 2 μg/ml Dox for 2 days. The levels of the metabolites of glycolysis (blue shaded), tricarboxylic acid cycle (green shaded), and nucleotide synthesis (gray shaded) were measured using liquid chromatography‑coupled tandem mass spectrometry/mass spectrometry analysis. *P < 0.05 (t‑test)

