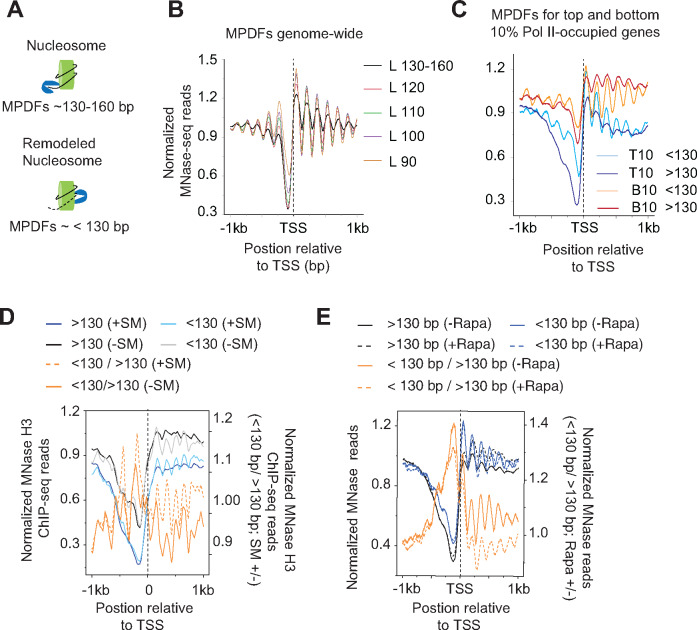
Figure 1.
Nucleosomes in transcribed coding sequences are more susceptible to MNase digestion.
(A) Schematic showing potential generation of MNase-protected DNA fragments (MPDFs) from nucleosomes. MNase digestion of DNA wrapped around histone octamer would likely generate MPDFs ∼130–160 bp, whereas a remodeled nucleosomes might be more accessible, leading to shorter MPDFs (<130 bp).
(B) MPDF profiles for fragment lengths ranging from 130-160 bp, <120–110 bp, <110–100 bp, <100–90 bp, and <90 bp are plotted for 5746 genes. MPDFs are plotted ±1000 bp around the transcription start site (TSS.)
(C) Metagene profile showing the average occupancies of MPDFs for the top (Pol II-T10) and bottom 10% (Pol II-B10) Pol II-occupied genes. MPDFs sizes <130 bp and >130 bp are plotted ±1000 bp around the TSS.
(D) Metagene profiles showing the average occupancies of MPDFs for the Gcn4-activated genes (n = 70 (Rawal et al.2018)) induced in the presence of SM (sulfometuron methyl; +SM) or in the absence of SM (–SM). MPDFs sizes <130 bp and >130 bp are plotted ±1 kb around the TSS. The values are plotted on the left-hand Y-axis, and <130 bp/> 130bp ratios for +SM (dashed-orange traces) and –SM (orange traces) are plotted on the right-hand Y-axis.
(E) Metagene profiles showing MPDFs sizes (<130 bp and >130 bp) for the TBP anchor-away strain treated without Rapa (–Rapa) or with (+Rapa) at the Pol II-T10 genes. The values are plotted on the left-hand Y-axis, and <130 bp/> 130bp ratio for the –Rapa (orange trace) and +Rapa (orange dashed trace) are plotted on the right-hand Y-axis. The TBP anchor-away data was taken from a previous study (Kubik et al.2018). MPDFs sizes <130 bp and >130 bp are plotted ±1000 bp around the TSS.

