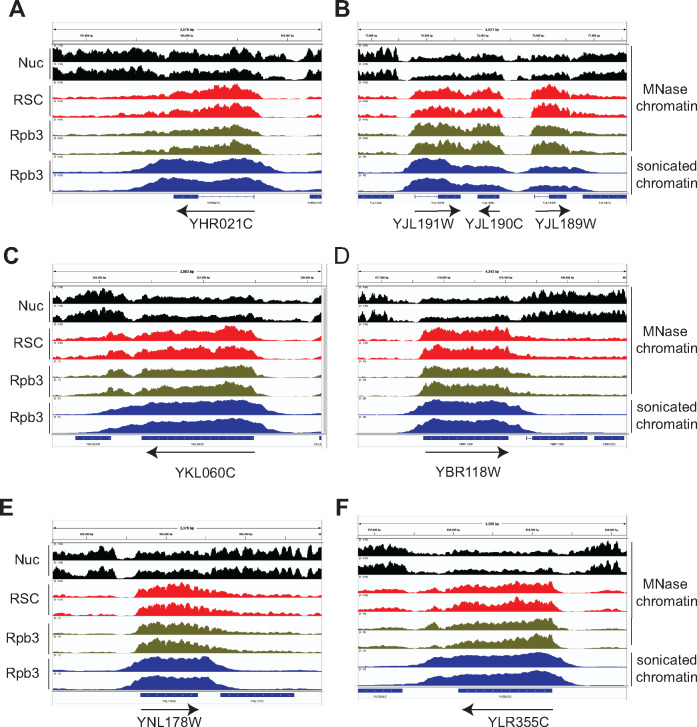
Figure 2.
RSC localizes to nucleosomes of many highly transcribed genes.
(A–F) Genome-browser shots are shown for a few representative genes showing high RSC occupancies in their CDSs. Nucleosomes (Nuc; MNase inputs, black), RSC MNase ChIP-seq (red), Rpb3 MNase ChIP-seq (green) and sonicated chromatin Rpb3 ChIP-seq (blue) data are shown in panels (A–F). Arrows denote 5′ to 3′ direction. Biological replicates are shown.

