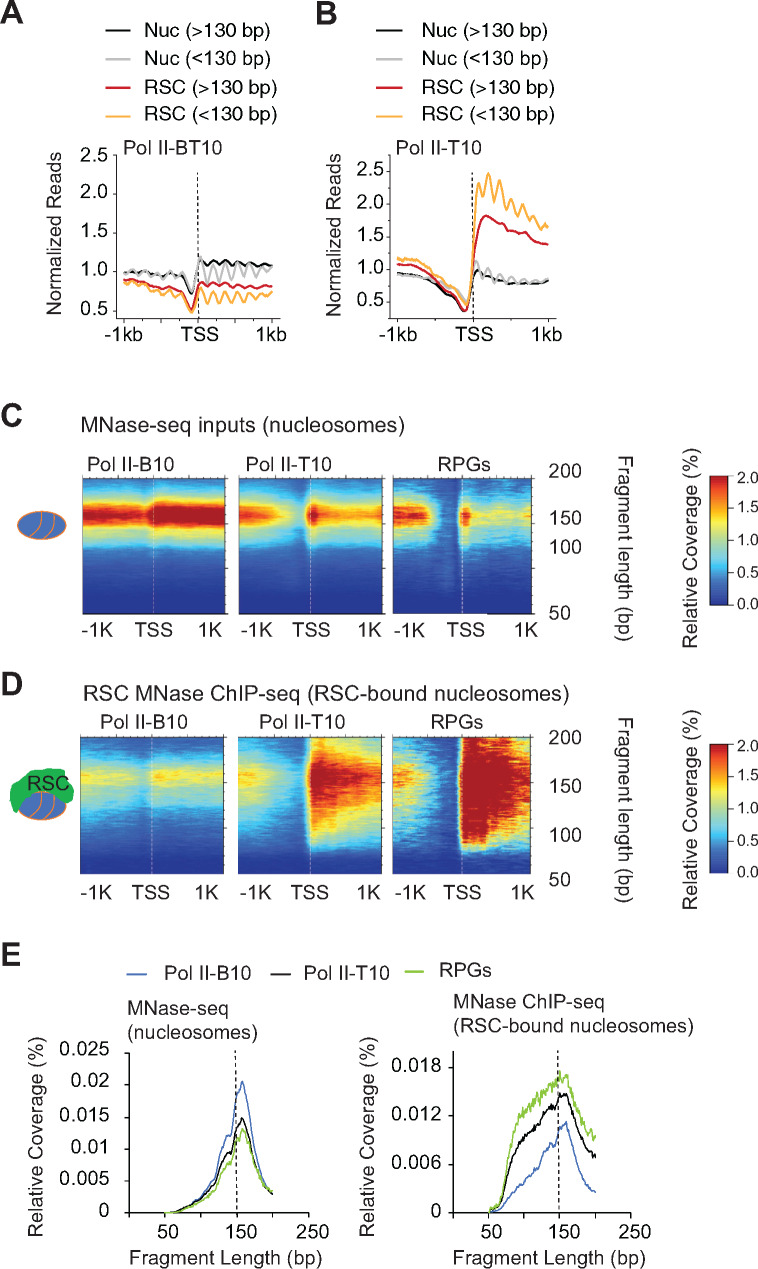
Figure 4.
RSC associates with both full-length and shorter MPDFs.
(A and B): Metagene profile showing normalized reads of MPDFs corresponding to the nucleosomes (MNase inputs; Nuc) and RSC-bound nucleosomes (RSC MNase ChIP-seq; RSC) for the bottom 10% (A) and top 10% Pol II-occupied genes (B).
(C and D): Heatmaps depicting 2D-occupancies of MPDF distribution around the TSS, with MPDFs shown on the Y-axis. MPDFs from nucleosomes (C) and RSC-bound nucleosomes (D) at the bottom 10% Pol II-occupied genes, top 10% Pol II-occupied genes, and at RPGs. (E) Metagene profiles depicting the relative amount of fragment lengths for the nucleosomes (left panel) and RSC-bound nucleosome MPDFs (right panel) observed in (C) and (D).

