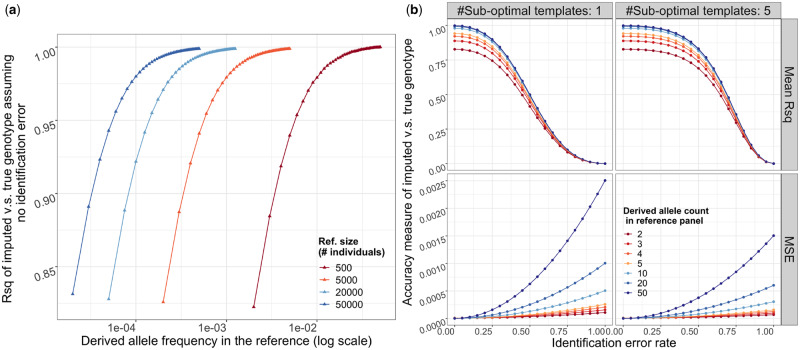
Figure 4.
(A) The upper bound of squared correlation (r2) (y-axis) between imputed and true genotype dosages, conditional on the DAF in the reference (x-axis). Color indicates the size of reference panel. (B) The r2 (top) and MSE (bottom) when a certain proportion of weight (x-axis) is attributed to suboptimal templates. The impact depends on the absolute number of suboptimal templates, we show examples of 1, 5 in the left and right columns. Here we fix the reference size to 20k. Results are from 50k independent coalescence simulations, each data point is an average of over 107 loci.

