
Figure 9.
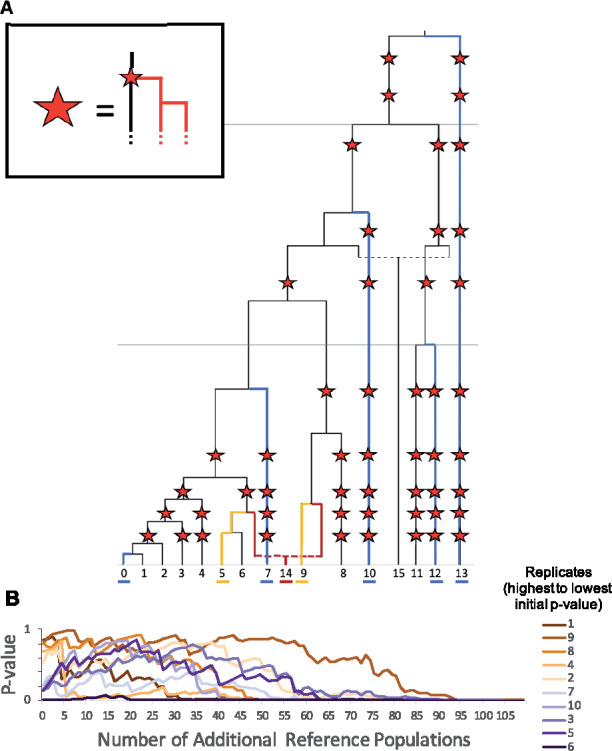
Inclusion of a large number of reference populations. (A) Population history of simulated data with additional populations added to tree. In all positions in the population history marked by a star, a population branching event occurs, forming an additional population. This new lineage undergoes an additional population branching event 50 generations later, resulting in two new populations created at each location marked with a star. Colors indicate the populations used in the base model, with the target in red, sources in yellow, and initial references shown in blue. (B) The change in P-values assigned to each model by qpAdm as additional reference populations are randomly added to the model. Each line tracks the P-values assigned to a single replicate [colors indicate initial P-value, ordered from highest (dark brown) to lowest (dark purple)], as the number of additional reference populations added to the base set of reference populations increases from 0 to 108.