
Figure 5.
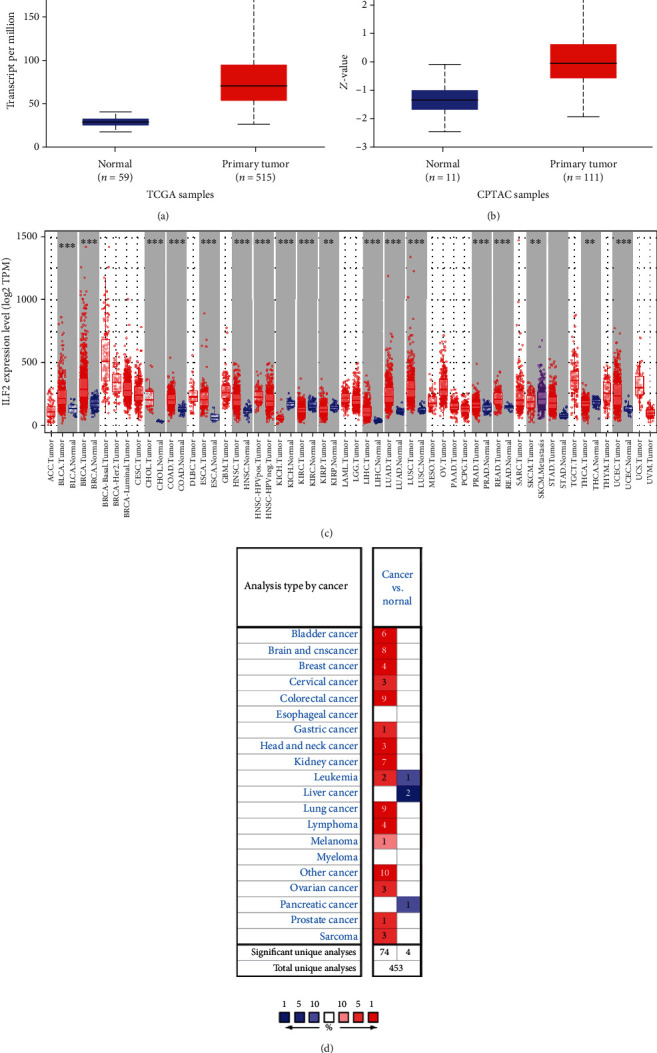
SHMT2 expression level (a) mRNA expression of SHMT2 in LUAD. The mRNA expression of SHMT2 is higher in tumor but lower in normal based on TCGA samples; (b) protein expression of SHMT2 in LUAD. The protein expression of SHMT2 is higher in tumor while lower in normal based on CPTAC samples; (c) the mRNA expression level of SHMT2 in various cancer. Color images are available online. Fold change = 2 and P value = 0.01; (d) SHMT2 different expression between tumor and adjacent normal tissue. ∗P < 0.05, ∗∗P < 0.01, ∗∗∗P < 0.001.