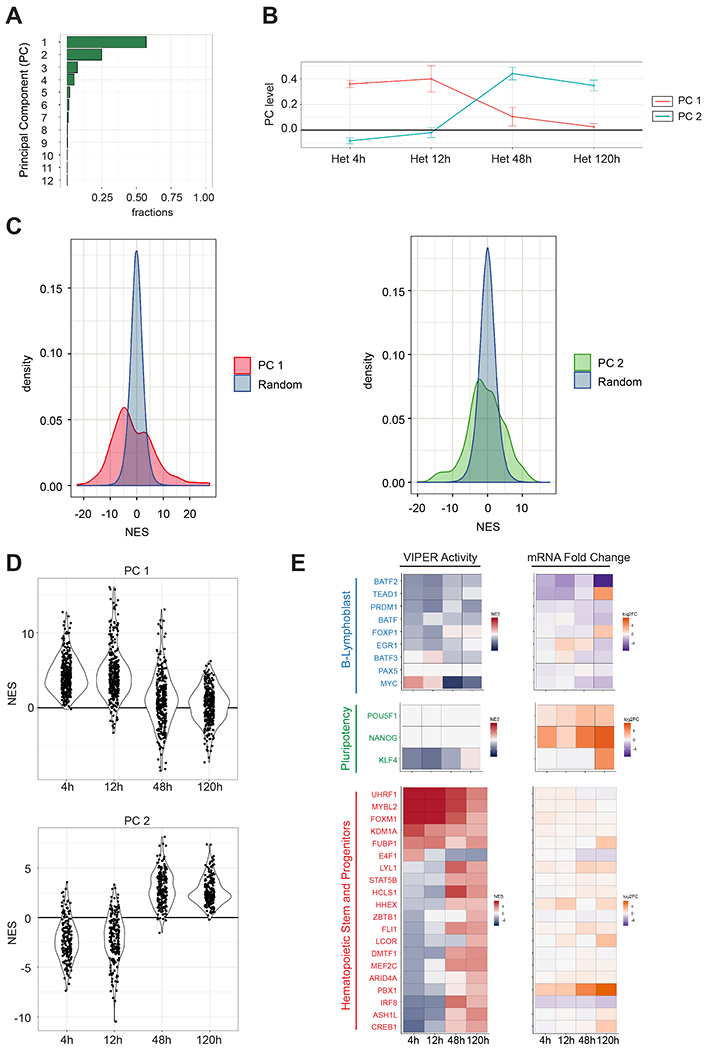
Figure 2. Two distinct clusters of transcription factors are sequentially activated in a time-dependent manner in the human EBV-B nuclei in the heterokaryons.

(A) Single Value Decomposition (SVD) analysis. PC are plotted on the y-axis and the proportion of variance of VIPER activity in the heterokaryon dataset is plotted on the x-axis. (B) PC levels across the sample time points for the top-2 PCs of the heterokaryon dataset. (C) Genes contributing significantly to the PCs 1 and 2 by comparing their PC coefficients with PC coefficients calculated from randomly shuffled VIPER activity levels. The random distributions are shown in blue and the coefficients PC 1 and PC 2 in red and green, respectively (p < 0.05). (D) Violin plots for VIPER-predicted activity levels represented by average NES for the 105 transcription factors (upper panel) significantly (p < 0.05) associated with PC 1 and for 64 transcription factors (lower panel) significantly associated with PC 2. VIPER-predicted activities were calculated comparing the heterokaryon samples of each time point against the unfused EBV-B cells. (E) VIPER-predicted activity and differential expression of a representative set of human genes during reprogramming. Positive NES values indicating active MRs are shown in red, and negative NES values indicating silenced MRs are shown in blue. mRNA Fold Change (Log2FC) was calculated using EdgeR by comparing the heterokaryon samples with unfused B-cells. Upregulated genes are shown in orange, and downregulated genes are shown in dark purple.
