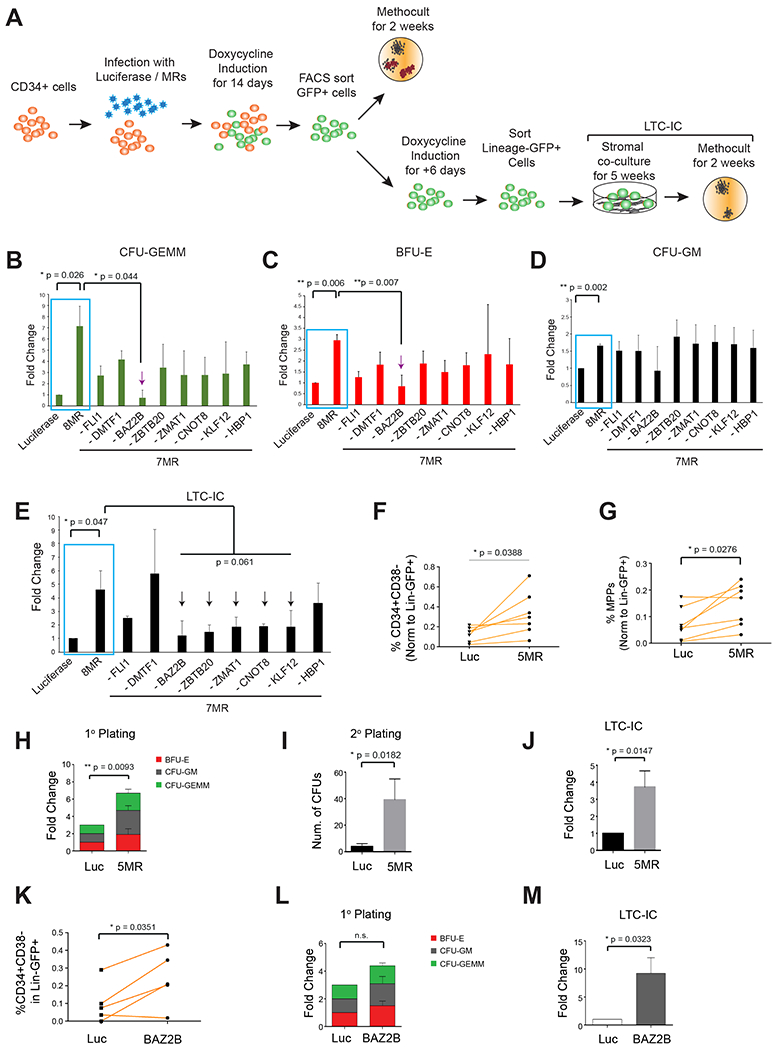
Figure 4. A combination of the predicted MRs enhances the stemness and long-term clonogenicity of CD34+ human hematopoietic cells.

(A) Schematic showing the experimental workflow of the first screen with human CD34+ hematopoietic stem and progenitor cells. (B-D) Human CD34+ cells infected with 8 MRs, or 8 combinations of 7 MRs were plated on methocult assays to count colonies of lineages (B) CFU-GEMM, (C) BFU-E and (D) CFU-GM based on morphology. N = 3 donors. Data represented as mean ± SD. (E) Sorted Lineage-GFP+ cells plated on LTC-IC assay followed by counting of colonies. N = 3 donors. Data represented as mean ± SD. Luc vs 8-MR: two-tailed paired t-test **P<0.01, *P<0.05. 8-MR vs 7-MR combinations: two-tailed unpaired t-test with unequal variance. (F-J) Overexpression of a combination of 5 MRs in human CD34+ cells. Lineage-GFP+ cells were FACS analyzed or characterized by in vitro colony assays. (F) Quantification of Lin-CD34+CD38− Stem Progenitors represented for N = 7 donors. (G) Quantification of MPPs represented for N = 7 donors. (H) Quantification of colonies from primary CFC assay N = 6 donors. Data represented as mean ± SD. (I) Quantification of colonies from secondary CFC assay N= 5 donors. Data represented as mean ± SD. (J) Quantification of colonies from LTC-IC CFC assay N = 5 donors. Data represented as mean ± SD. (K-M) Human CD34+ cells transduced with Luciferase or BAZ2B for in vitro analysis. (K) Quantification of the CD34+CD38− multipotent stem progenitor within Lineage-GFP+ cells from N = 5 donors (L) Quantification of colonies from primary CFC assay N = 5 donors. Data represented as mean ± SD. (M) Quantification of colonies from LTC-IC CFC assay N= 5 donors. Data represented as mean ± SD. (B-M) Two-tailed paired t-test, unless specified otherwise **P<0.01, *P<0.05.
