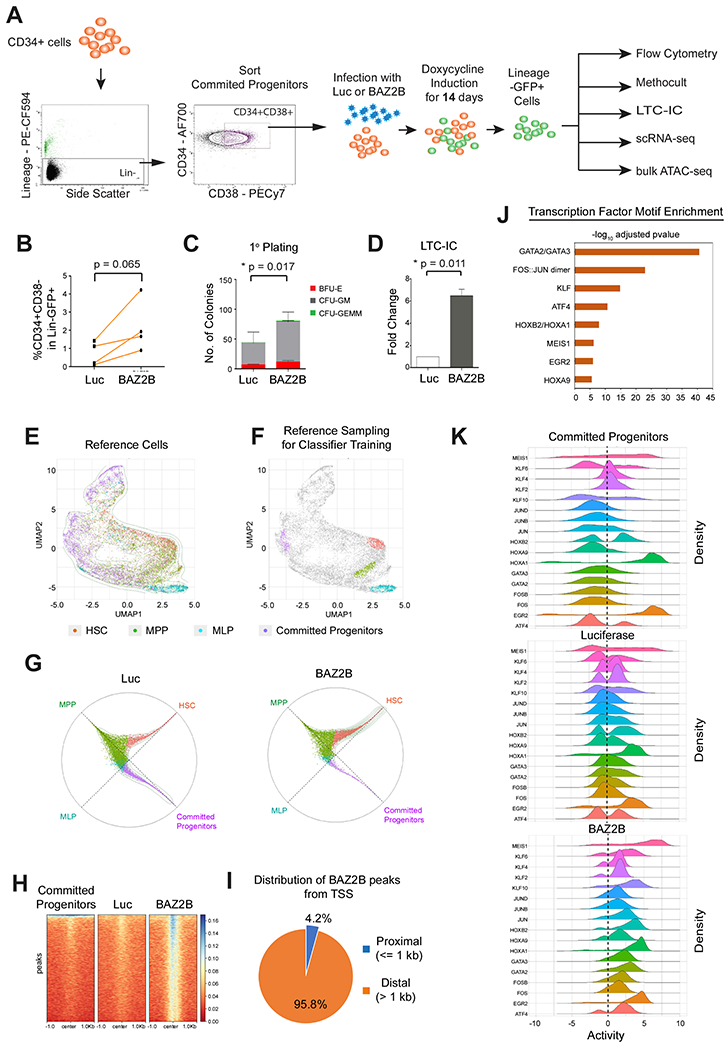
Figure 6. BAZ2B induces reprogramming of lineage committed hematopoietic progenitors to multipotent state by chromatin remodeling.

(A) Lineage-CD34+CD38+ committed progenitors were transduced with Luciferase or BAZ2B for in vitro analysis. (B) Quantification of the CD34+CD38− multipotent stem progenitor within Lineage-GFP+ cells from N = 4 donors. (C) Quantification of colonies from primary CFC assay N = 3 donors. Data represented as mean ± SD. (D) Quantification of colonies from LTC-IC CFC assay N= 3 donors. Data represented as mean ± SD. (B-D) Two-tailed paired t-test **P<0.01, *P<0.05. (E) UMAP visualization of the four reference populations FISCs, MPPs, MLPs and Lineage Committed Progenitors in VIPER space. (F) Top 1% of the cells of the four reference populations used for the random forest model, based on their differential density in the UMAP space. (G) Circular visualization of the model classification for Luciferase and BAZ2B samples. Samples closer to the circumference have a definite classification, and the plotting angle for each sample is determined by the weighted average of the model’s classification votes. (H) Heatmap of ATAC-Seq peaks showing unique SAZ2S-induced chromatin-accessible regions. (I) Distribution of BAZ2B-induced unique ATAC-Seq peaks from the transcription start sites. (J) Transcription factors with enriched motifs in the BAZ2B-induced nucleosome-free regions and a predicted VIPER activity > 1. (K) Ridgeline density plots showing VIPER-activity from single-cell RNA-Seq samples for 17 transcription factors (VIPER activity > 1) with enriched motifs in BAZ2B-induced nucleosome-free regions.
