
Fig. 1 |. scRNA-seq analysis of astrocytes in EAE.
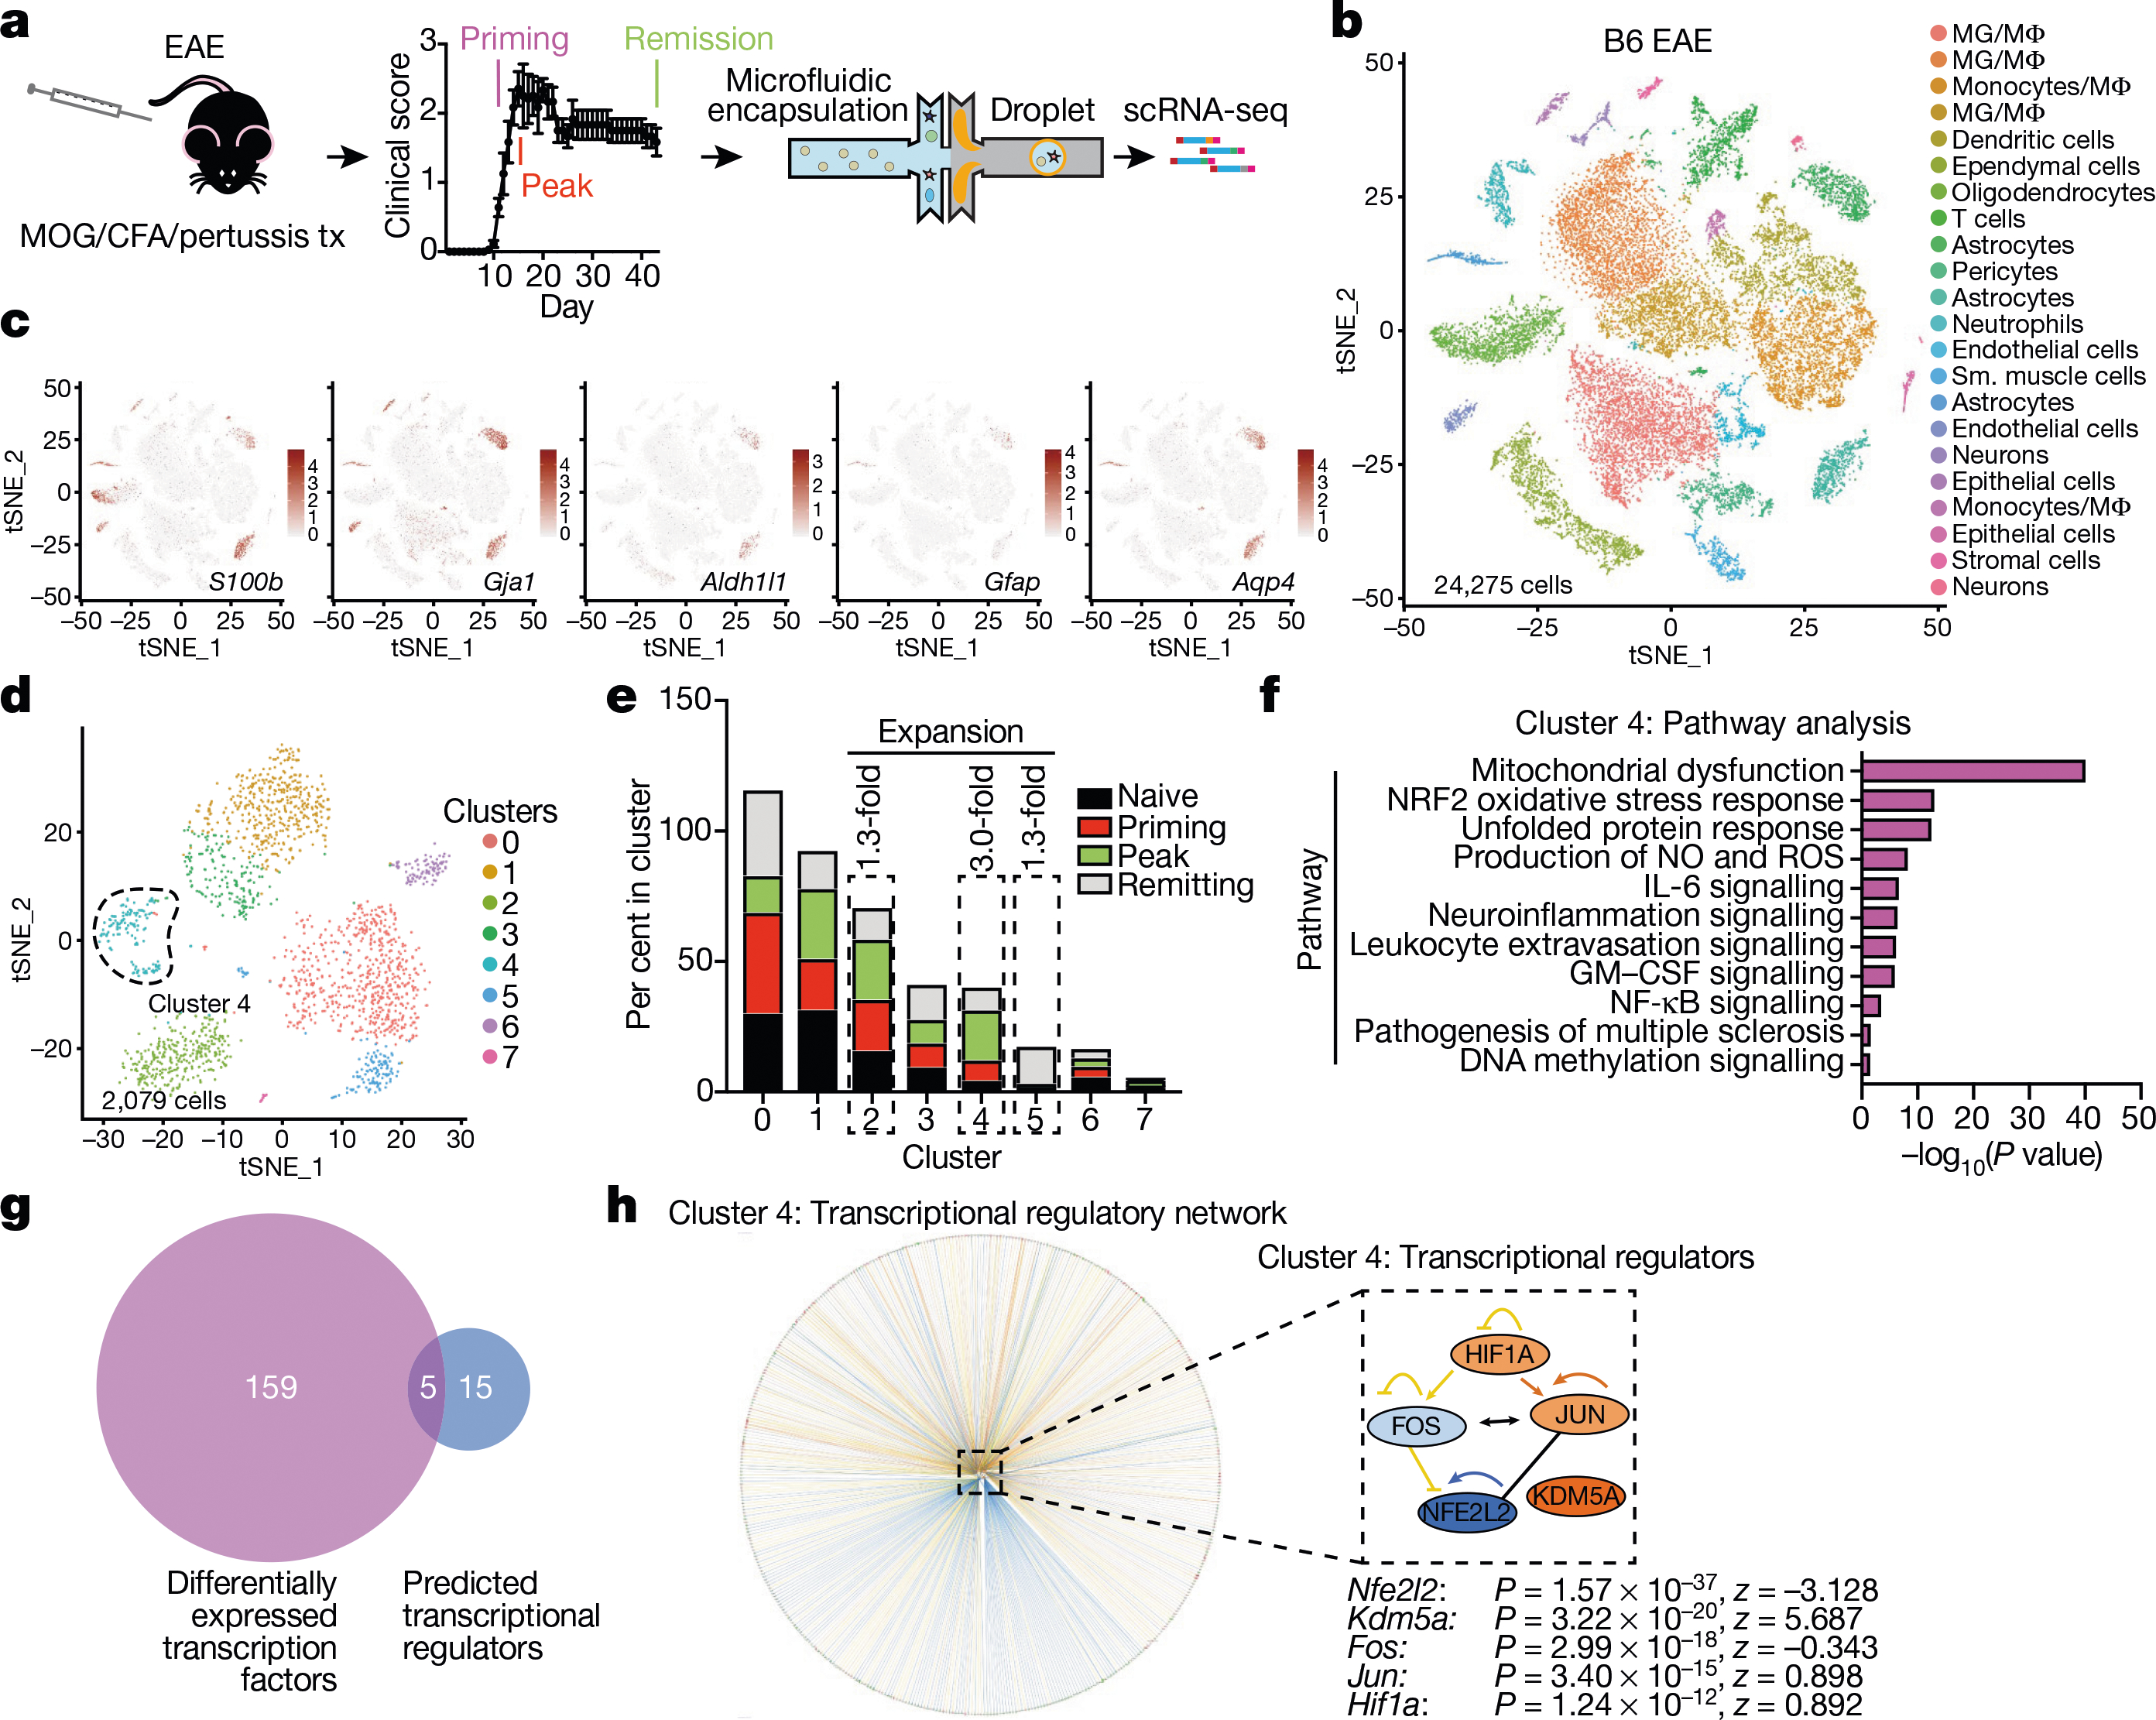
a, scRNA-seq analysis of CNS samples. Mice per group are n = 6 naive, n = 4 priming, n = 6 peak, n = 6 remission, n = 3 CFA. b, Unsupervised clustering t-distributed stochastic neighbour embedding (tSNE) plot of CNS cells from mice with EAE. MG, microglia; MΦ, macrophages. c, Expression scatterplots of astrocyte markers in population from b. n = 6 naive, n = 4 priming, n = 6 peak, n = 6 remission, n = 3 CFA. d, Unsupervised clustering tSNE plot of astrocytes. e, Cluster analysis of astrocytes based on per cent composition in EAE. f, Ingenuity pathway analysis (IPA) of cluster 4 astrocytes (n = 2,079 cells). g, Overlap between differentially expressed cluster 4 transcription factors and IPA predicted cluster 4 transcriptional regulators. h, Regulatory network of the intersection shown in g in cluster 4 astrocytes (n = 2,079 cells). Right-tailed Fisher’s exact test. Data shown as mean ± s.e.m.