
Fig. 5 |. GM-CSF signalling promotes pathogenic activity in astrocytes.
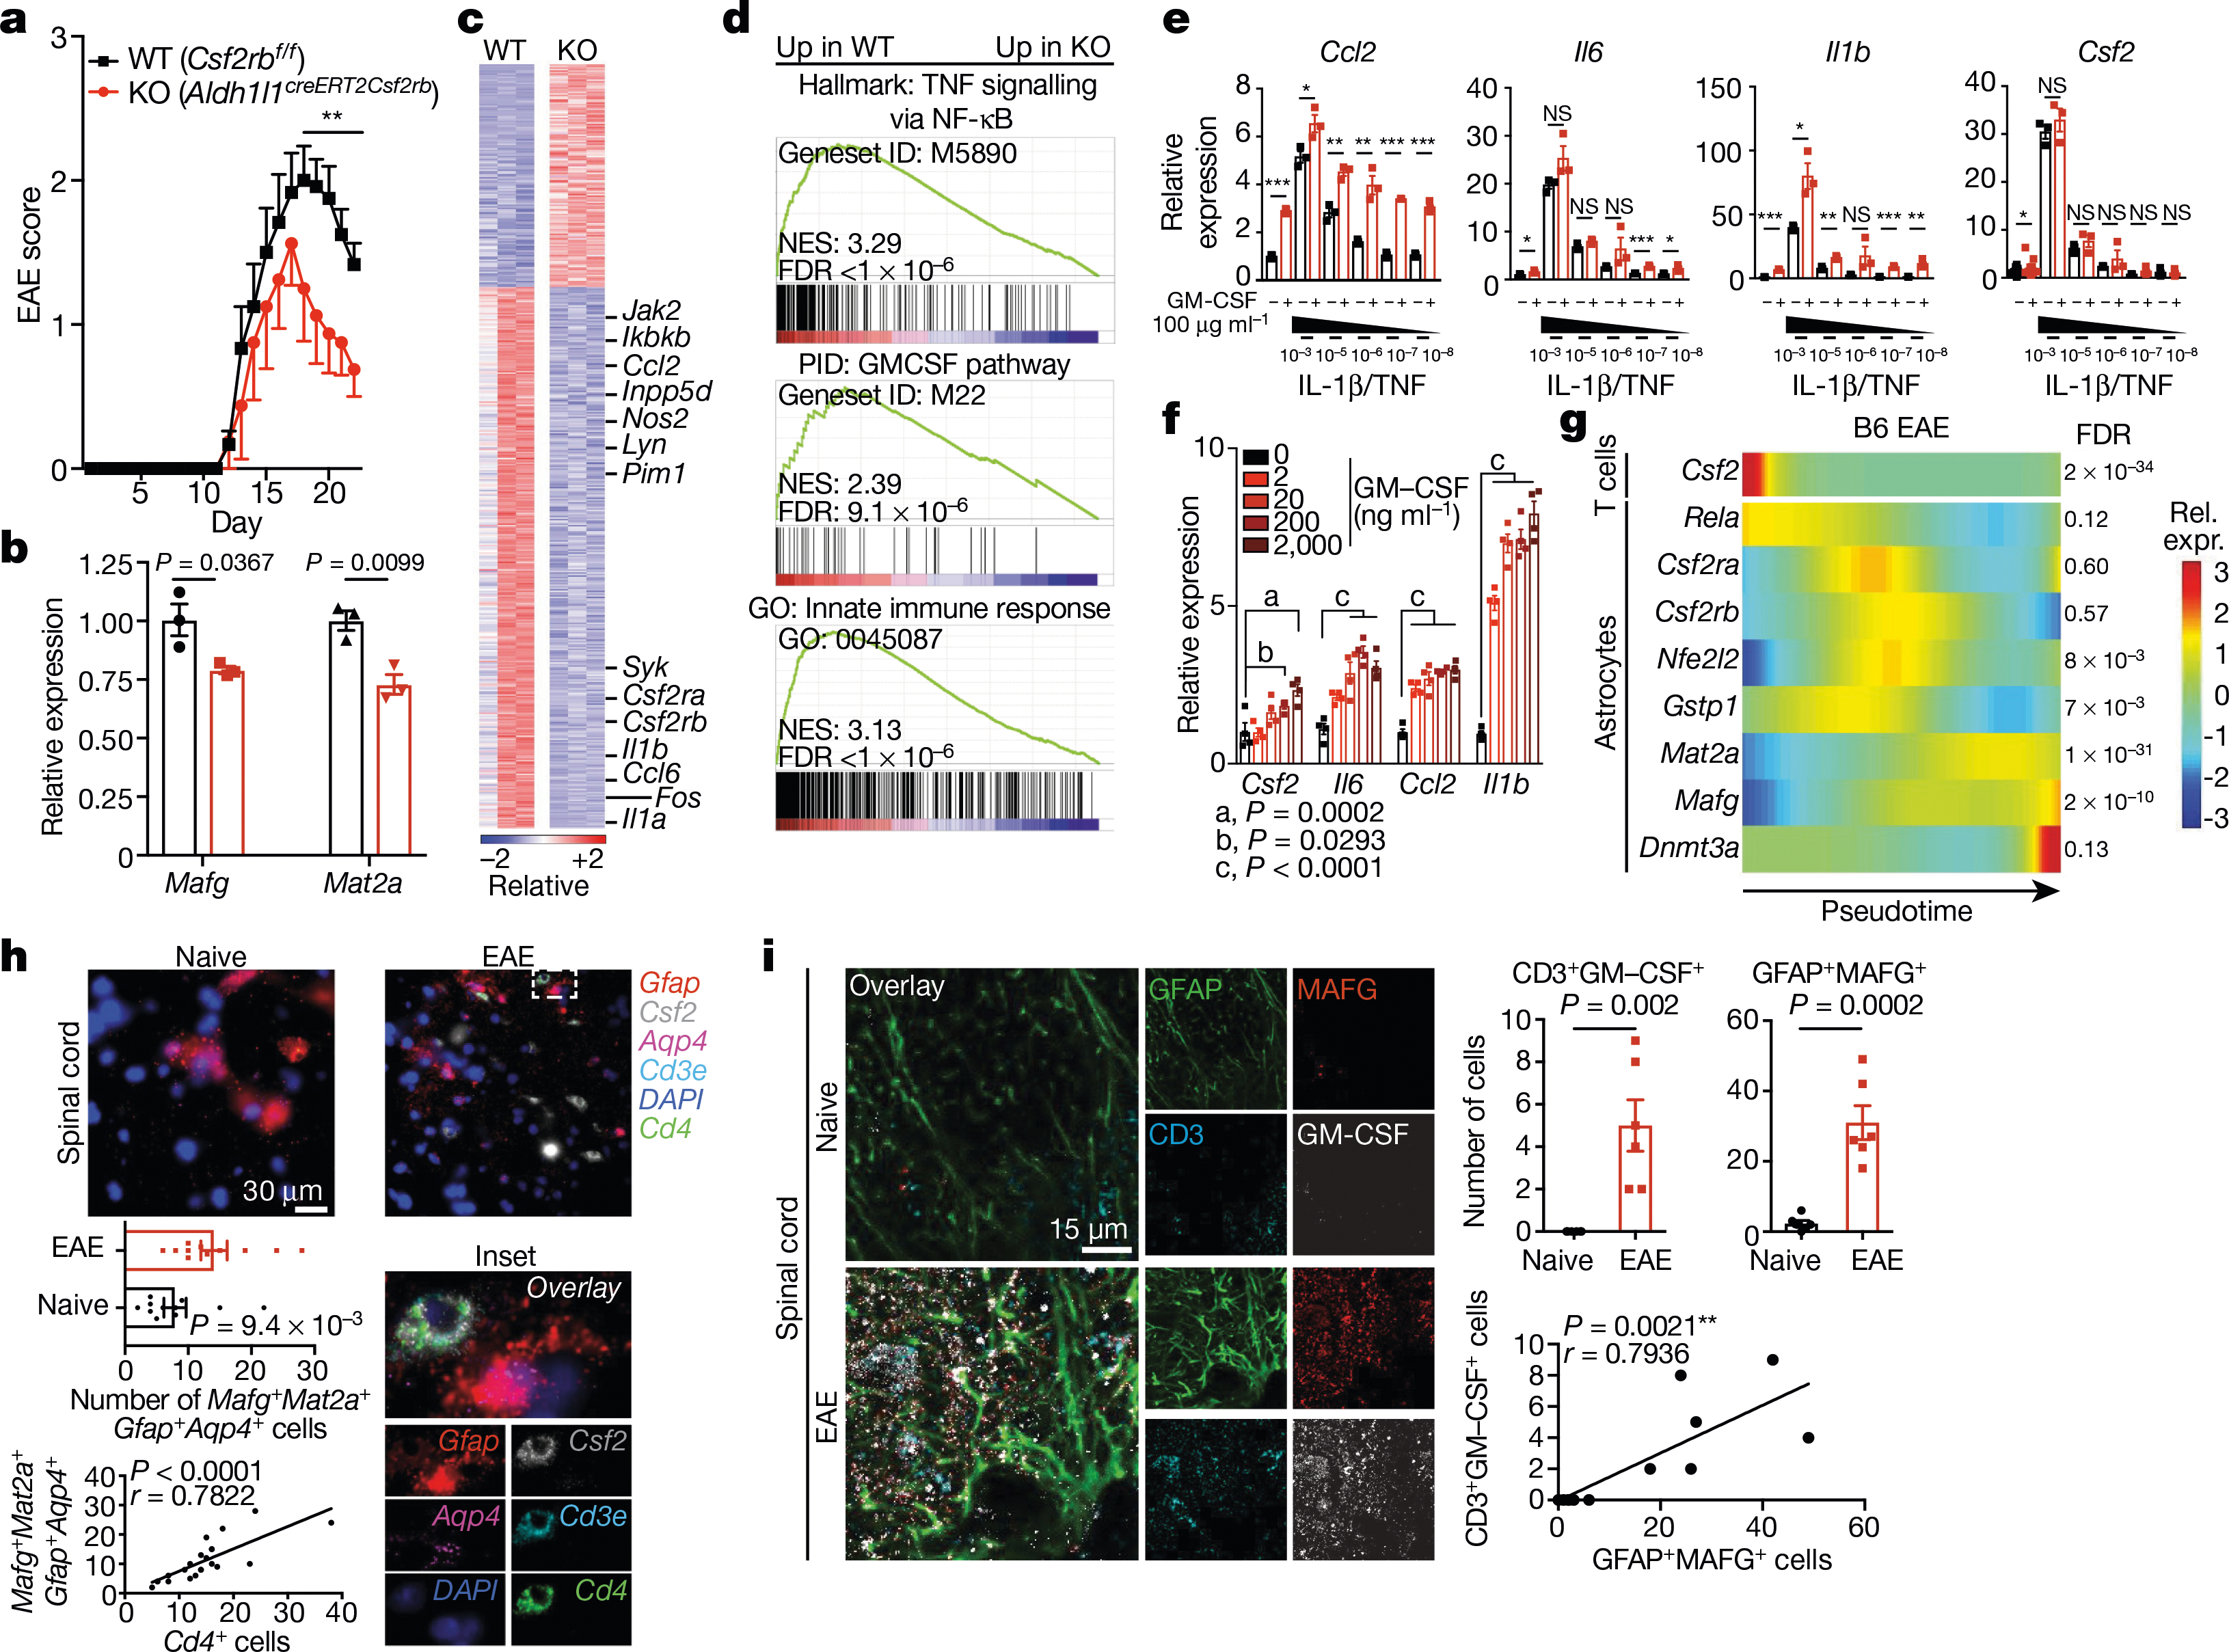
a, EAE progression in wild-type (WT) mice and mice lacking Csf2rb (KO). n = 12 (WT), n = 8 (KO). Experiment repeated twice. Two-way repeated measures ANOVA. Statistical values by day (d) are: d18 (**P = 0.0078), d19 (**P = 0.0015), d20 (**P = 0.0009), d21 (**P = 0.0078), d22 (**P = 0.0097). b, qPCR analysis of expression of Mafg and Mat2a in astrocytes from WT and KO mice (EAE day 22). n = 3 per group; unpaired two-tailed t-test per gene. c, RNA-seq analysis of differential gene expression between astrocytes from WT and KO mice (EAE day 22). n = 3 per group. d, GSEA for genes differentially expressed in WT versus KO mice. n = 3 mice per condition. e, qPCR analysis of gene expression in primary astrocytes with or without different doses of GM-CSF or escalating doses of IL-1β/TNF. n = 3 per condition; n = 18 for Csf2–vehicle. Unpaired two-tailed t-test per grouping, Csf2 data log-normalized. f, qPCR of GM-CSF dose response in primary astrocytes. n = 4 biologically independent samples per condition. Experiment repeated twice. Two-way ANOVA, Dunnett post-test. g, Pseudotime analysis of scRNA-seq data from B6 mice with EAE. n = 9,629 cells. h, Multiplexed FISH analysis of gene co-expression in astrocytes from mice with or without EAE. n = 11 per group from n = 3 mice. Unpaired two-tailed Mann–Whitney test (top), Pearson’s correlation (bottom). i, Immunostaining (left) and quantification (right) of MAFG+ astrocytes in close proximity to GM-CSF+ T cells in spinal cord from mice with or without EAE. n = 6 images per group from n = 3 mice. Unpaired two-tailed t-test (top), Pearson’s correlation (bottom). ***P < 0.001, **P < 0.01, *P < 0.05, NS P > 0.05 (not significant). Data shown as mean ± s.e.m.