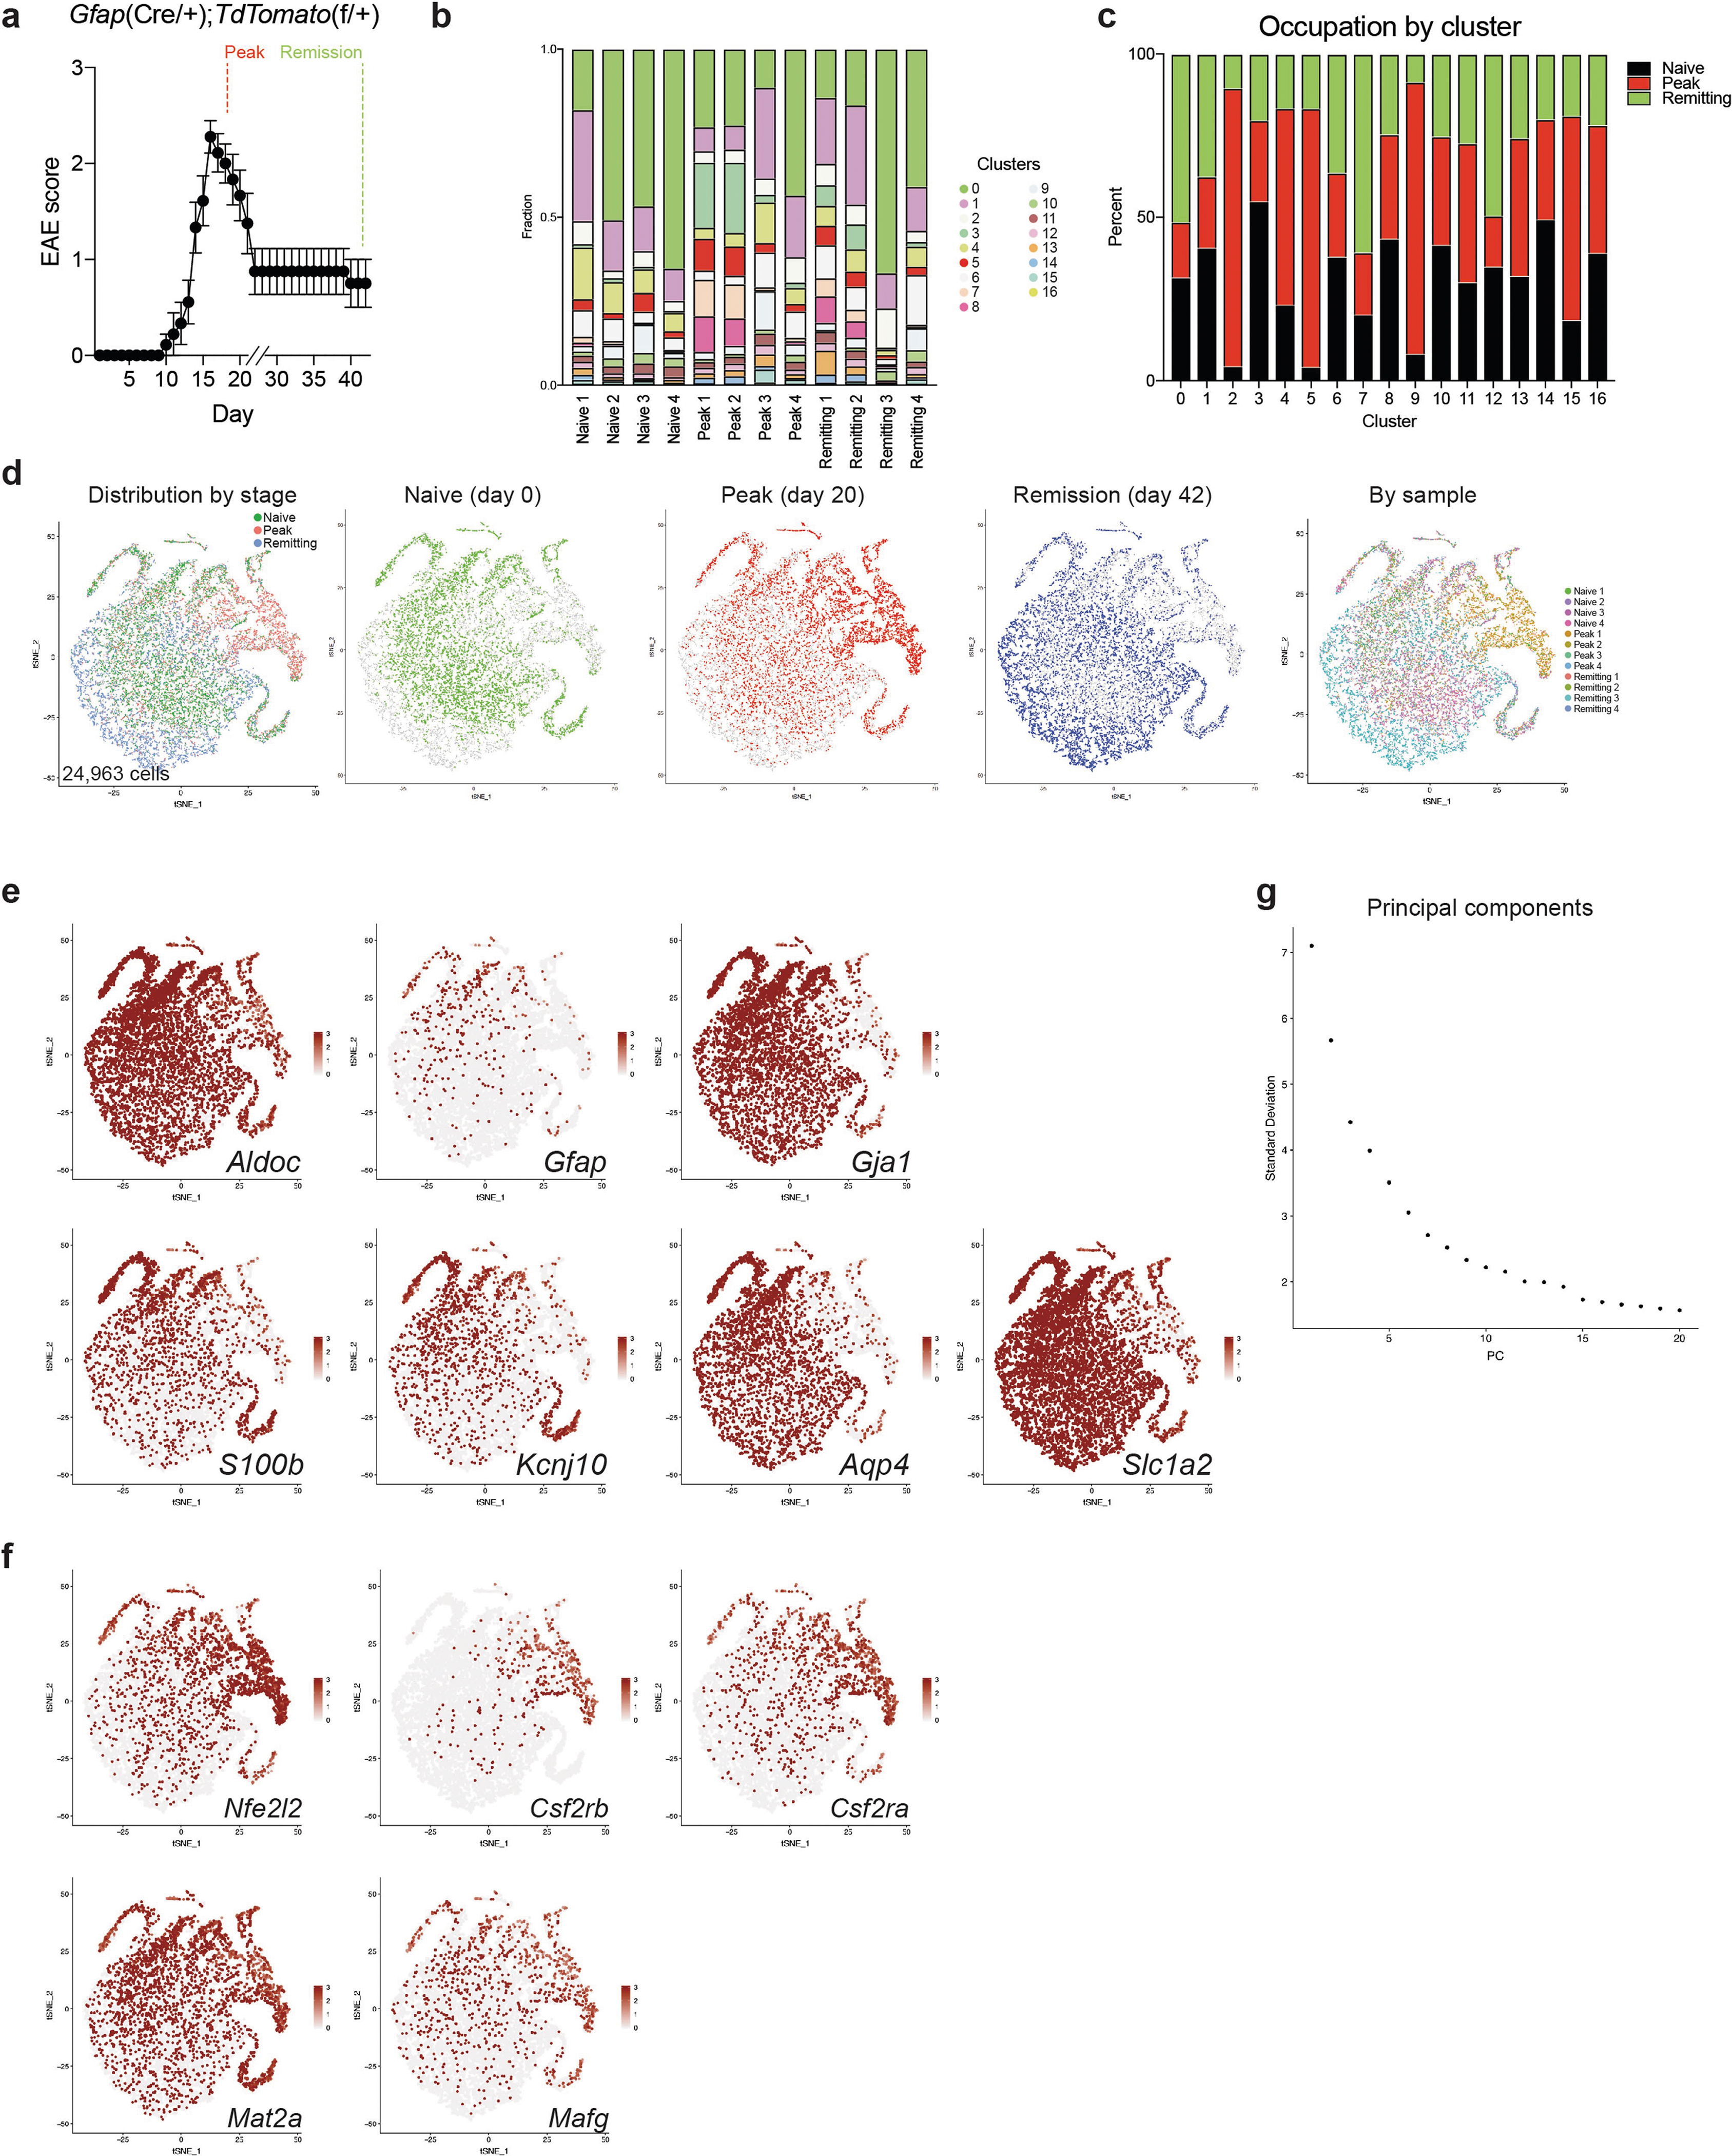
Extended Data Fig. 3 |. Expression of Mafg and Nfe2l2 in astrocytes.

a, EAE in TdTomatoGfap mice used for scRNA-seq. n = 4 mice per time point. b, Cluster composition by replicate. c, Cluster composition by EAE time point. d, Unsupervised clustering tSNE plot of TdTomatoGfap astrocytes from mice with EAE. n = 4 per group (peak, day 20 post-induction; remission, day 42 post-induction). e, Scatterplots of astrocyte markers. f, Scatterplots of genes of interest in this study. g, Principal components used in this analysis. n = 24,963 cells for all scRNA-seq experiments.
