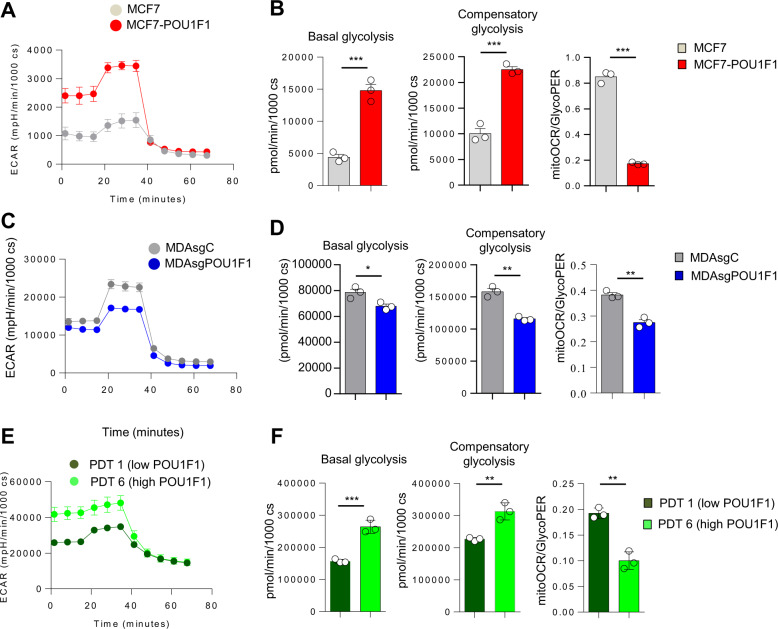
Fig. 2. POU1F1 regulates the glycolytic profile of breast cancer cell lines and primary tumors in vitro.
A Representative ECAR Glycolytic Rate Assay profile in MCF7 and MCF7-POU1F1 cells. cs cells. B Quantification of basal glycolysis, compensatory glycolysis and mitoOCR/glycoPER basal ratio in MCF7 and MCF7-POU1F1 cells. C Representative ECAR Glycolytic Rate Assay profile in control (MDAsgC) and POU1F1-knocked-out MDA-MB-231 (MDAsgPOU1F1) cells. D Quantification of basal glycolysis, compensatory glycolysis and mitoOCR/glycoPER basal ratio in MDAsgC and MDAsgPOU1F1 cells. E Representative ECAR Glycolytic Rate Assay profile in human primary breast tumor-derived cultures (see Fig. 6D) with low POU1F1 expression (PDT 1) and high POU1F1 expression (PDT 6). F Quantification of basal glycolysis, compensatory glycolysis and mitoOCR/glycoPER basal ratio in PDT 1 and PDT 6. Data are expressed as mean ± SEM. *P < 0.05, **P < 0.01, and ***P < 0.001.

