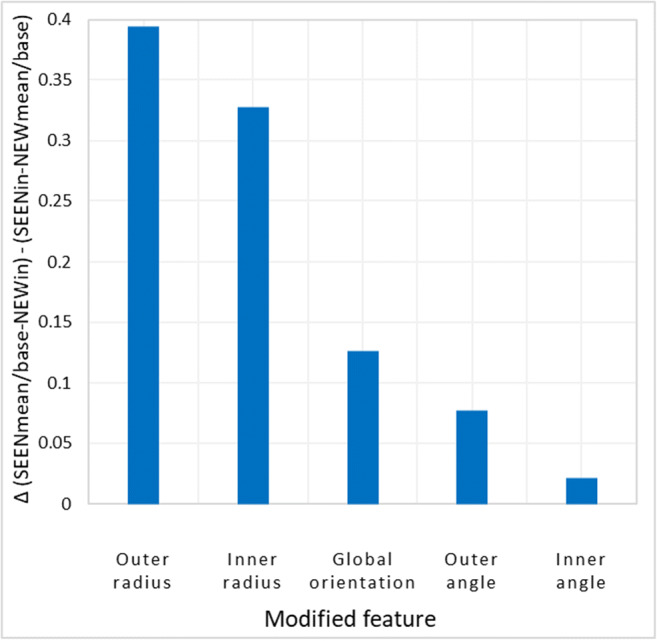
Fig. 10.

Relative contribution of each feature modification to mean and base effects. The contributions were evaluated by a measurement of both mean and base effects (subtraction of trials wherein mean/base were SEEN shapes from trials where mean/base were NEW shapes in the two-alternative forced-choice (2-AFC) membership tasks). These effects were calculated separately for each feature modification of the NEW and SEEN shapes and plotted here
