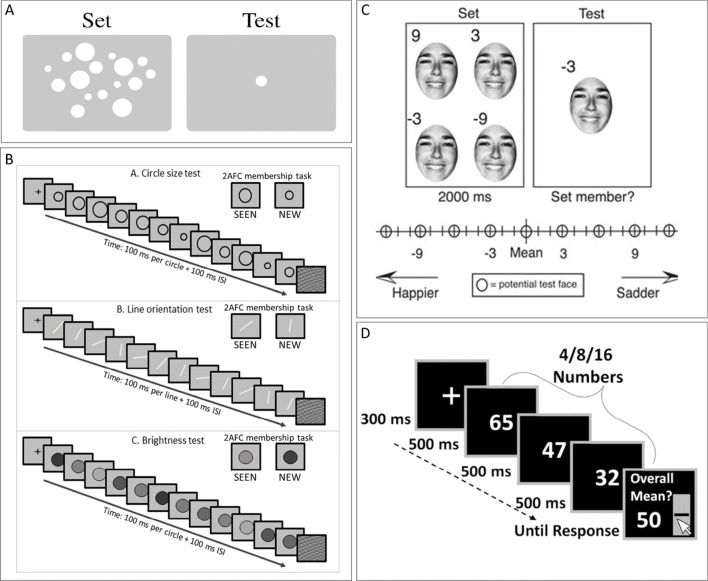
Fig. 2.
Previous study stimulus sets. (A) Ariely’s (2001) schematic representation of the two intervals used in his experiment’s trials. Observers were exposed for 500 ms to a set of spatially dispersed circles differing by size and then asked if a test stimulus size had been present in the set, or is smaller/larger than the set mean. (B) Khayat and Hochstein’s (2018) RSVP sequences consisted of 12 elements, each presented for 100 ms plus a 100-ms inter-stimulus interval (ISI), followed by a two-alternative forced-choice (2-AFC) membership test (i.e., which test element had been present in the sequence). Blocks contained circles differing in size, lines differing in orientation, or discs differing in brightness. Observers were asked which of two test elements was present in the set. They were unaware that either test element could equal the set mean or the nonmember could be outside the set range. (C) Haberman and Whitney’s (2009) task included four faces (from a set of 4, 8, 12, or 16), differing in facial emotional expression, presented for 2 s. Observers then indicated whether the test face was a member of the set, or was happier/sadder than the set mean. (D) Brezis et al.’s (2015) trials consisted of two-digit numbers sequentially presented at a rate of 500 ms/stimulus. Set size was 4, 8, or 16. Participants estimated set average

