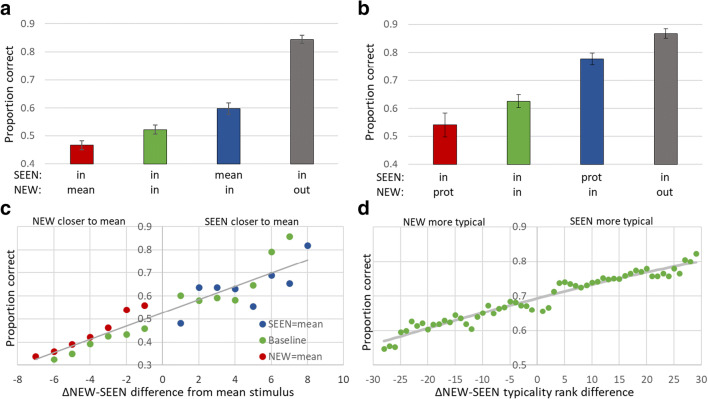
Fig. 3.
Low-level parameter mean perception (a, c) compared to category prototype perception (b, d). Participants viewed a sequence of images varying in a low-level parameter (Fig. 1b), i.e., circle size, line orientation, or disc brightness (a, c), or a sequence of object images from a single category (b, d), followed by two test images, one SEEN in the sequence and one NEW. They were asked to choose the SEEN image. Participants had difficulty remembering sequence images. Instead, the SEEN (graph blue bar) or NEW (red) image that matched the mean or category prototype was preferred, relative to the case where neither test image matched the mean or prototype (green) and a NEW image from outside the range or from a different category was rejected (black). See text. From Khayat and Hochstein (2018, 2019a). This preference was graded in that the closer the test image to the mean (c) or the greater its category typicality (d), the greater the chance of its being chosen as SEEN, as measured by probability of choice dependence on the difference between the test images’ distance from the mean (c) or difference in their typicality (d). prot = prototypical object image, in = in range, out = out of range, mean = ensemble mean. Error bars in all figures indicate standard error of the mean. Differences in mean accuracy between all pairs of trial subtypes in both low-level and categorization studies were significant, p < 0.05

