
Figure 1.
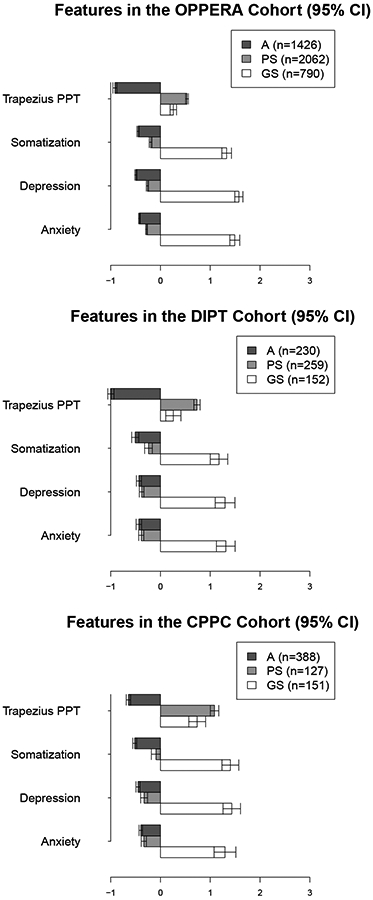
Mean values (95% CI) for the cluster features in each of the three cohorts. Cluster labels were obtained by assigning individuals using ROPA; variables in the figures have been standardized.
Note: The features presented are for clusters based on ROPA.