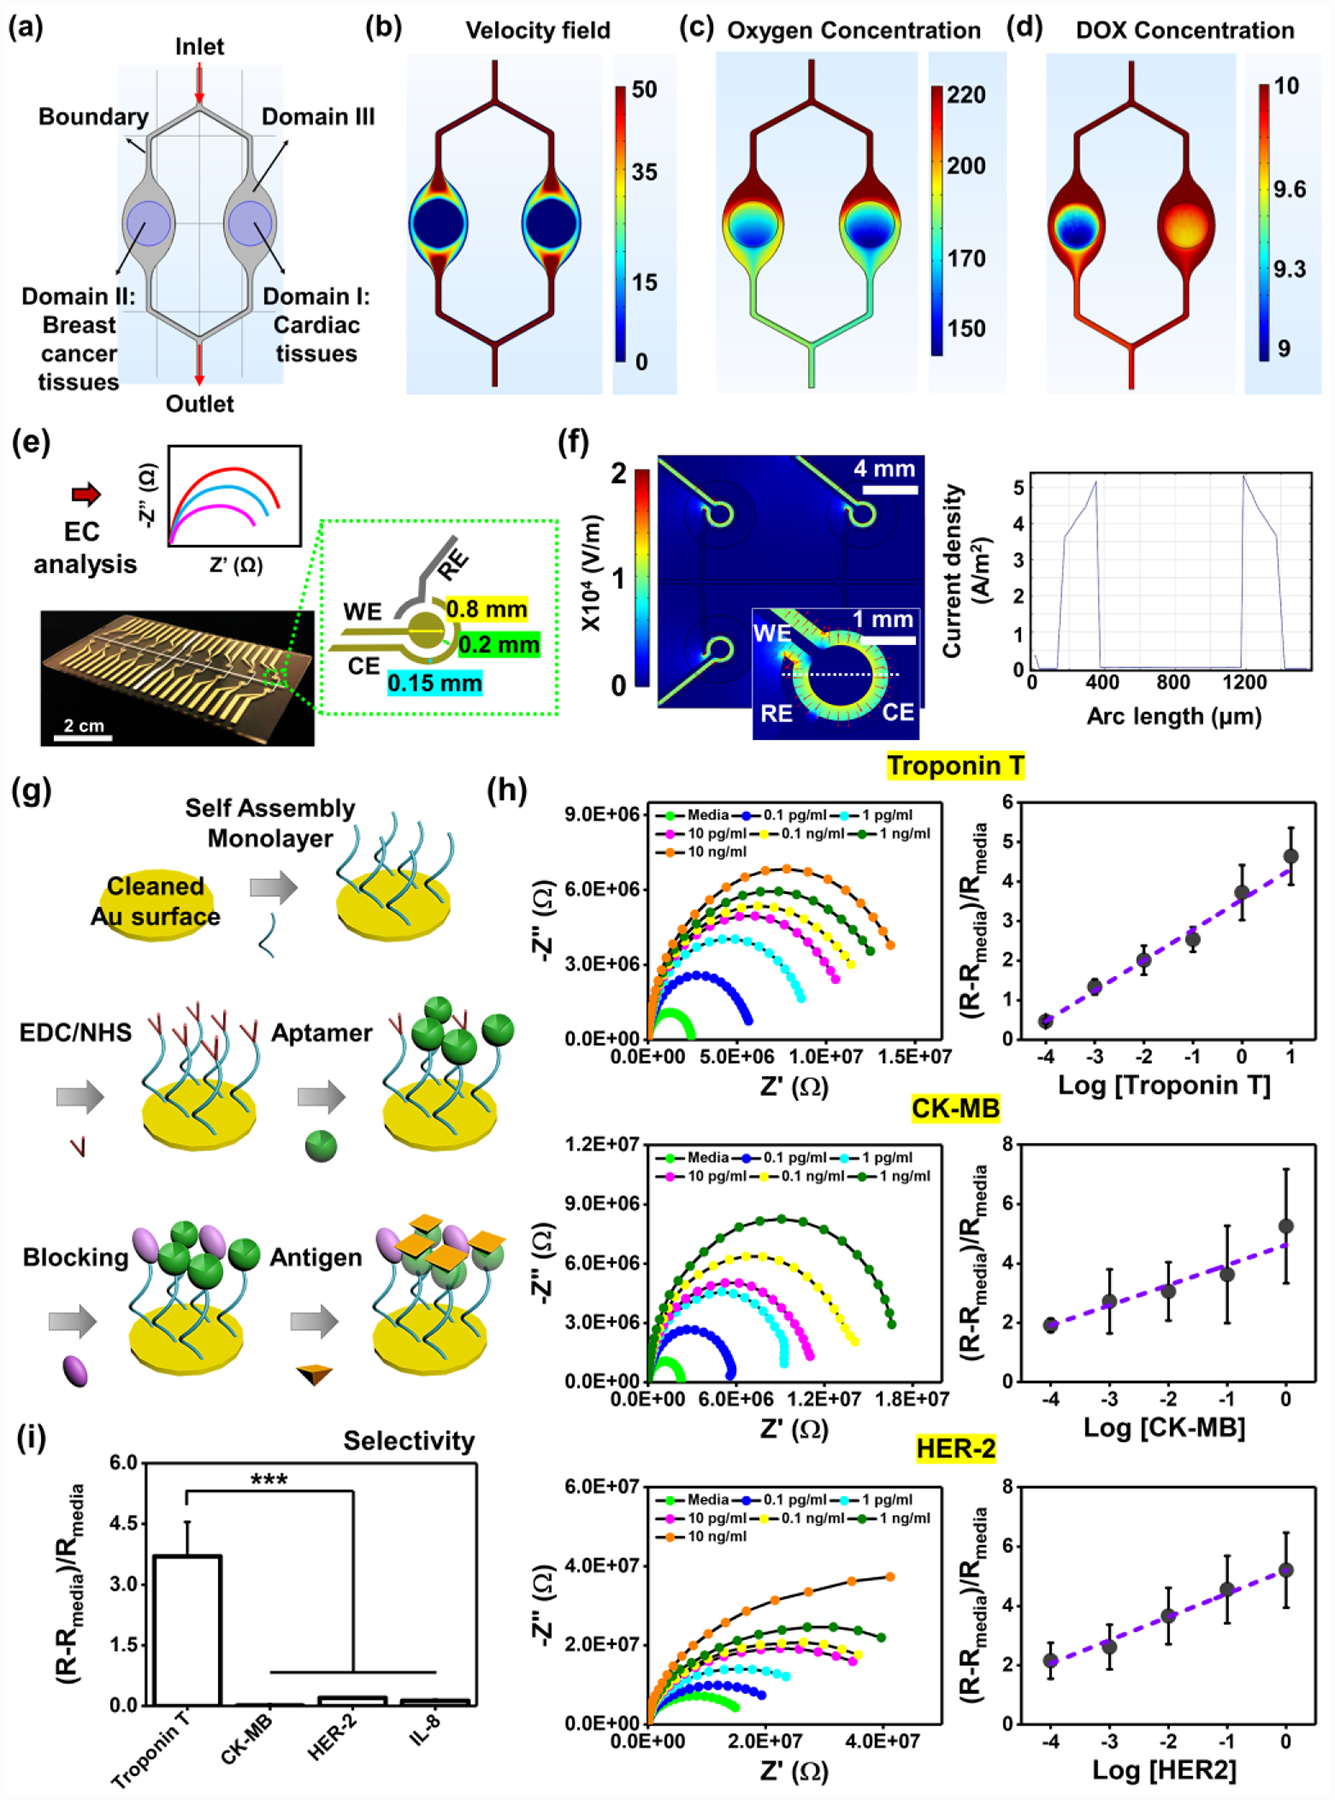
Figure 4. Development of the EC aptamers-functionalized biosensors for detection of multiple biomarkers produced from cardiac or BC tissues.

Mathematical model of a) geometry consisting of three different domains (Domain I: cardiac tissues, Domain II: BC tissues, and Domain III: fluidic channels) for simulating b) velocity field, c) oxygen concentration, and d) DOX concentration. e) Multielectrode array design, fabrication and plug-in cable connector: the microelectrode containing RE (Ag), WE (Au), and CE (Au). f) A map plot of the electric fields using a COMSOL simulation (top) and current density plot along the cut line as shown in electric field map. The first peak refers to the current between RE and WE, the second peak between WE and CE. g) A schematic illustrating immobilization of aptamers-functionalized biosensors on the surface of the microelectrodes. h) Nyquist and standard curves of multielectrode array chip for representative cardiac biomarkers, Troponin T and CK-MB, and BC biomarker, HER-2 (N= 3). i) Selectivity of Troponin T sensors in the presence of multiple unspecific biomarkers at a concentration of 1 ng/mL. (One-way ANOVA with Tukey significant difference post-hoc test; ***p<0.0005). Error bars represent standard deviation.
