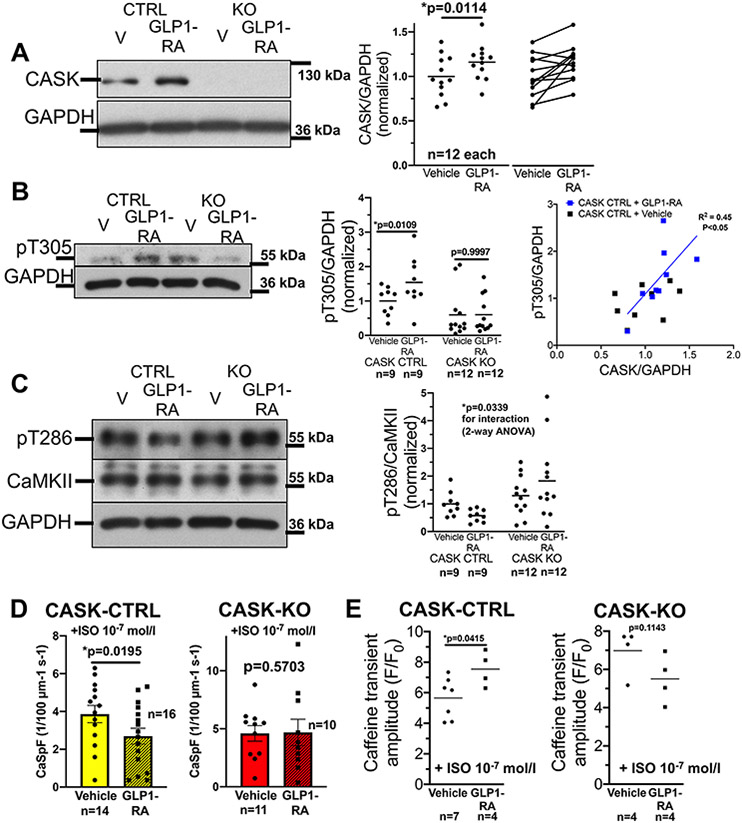
Figure 6: CASK expression is increased upon GLP1-receptor agonist treatment.
A) Original Western blots and mean densitometric data of CASK-expression in isolated ventricular cardiomyocytes from CASK-CTRL or CASK-KO mice that were harvested 24 h after culture with either vehicle control (DMSO) or 100 nmol/L of the GLP1-receptor agonist (GLP1-RA) exenatide. Data follows normal distribution (D’Agostino-Pearson-test) and was compared by paired t-test (p in graph, n=mice). B) Left panel: original Western blots and mean densitometric data of T305-phosphorylation (original registration contrast-enhanced equally across all lanes). Data are normally distributed (D’Agostino-Pearson test) and tested by two-way mixed-effects analysis (substance *p=0.0278, genotype *p=0.0115, interaction *p=0.0295) with Sidak post-tests (p in graph). Right panel: CASK-expression correlates strongly with T305-phosphorylation (linear regression p<0.05, R2=0.45).
C) Original Western blots and mean densitometric data of CaMKII T286-phosphorylation. Data are normally distributed (D’Agostino-Pearson test) and tested by two-way ANOVA (genotype *p=0.0274, substance p=0.8033, interaction *p=0.0339). n=mice)
D) Mean data of SR Ca spark frequency (CaSpF) as a marker of SR Ca leak in isolated ventricular cardiomyocytes from CASK-CTRL (left panel) or CASK-KO (right panel) mice that were harvested 24 h after culture with either vehicle control (DMSO) or 100 nmol/L of GLP1-RA and exposed to 10−7 mol/l isoproterenol. Data are normally distributed (D’Agostino-Pearson test) and compated by paired t-test (p in graph, n=mice)
E) Mean data of Caffeine transient amplitude in Fluo-4 –loaded isolated ventricular myocytes that were harvested 24 h after culture with either vehicle control (DMSO) or 100 nmol/L of GLP1-RA and exposed to 10-7 mol/l isoproterenol. Left panel: CASK-CTRL. Data are normally distributed (Shapiro-Wilk-test) and compared by paired t-test (p in graph, n=mice). Right panel: CASK-KO. Data are not normally distributed (Shapiro-Wilk-test) and tested by Wilcoxon test (p in graph, n=mice).

