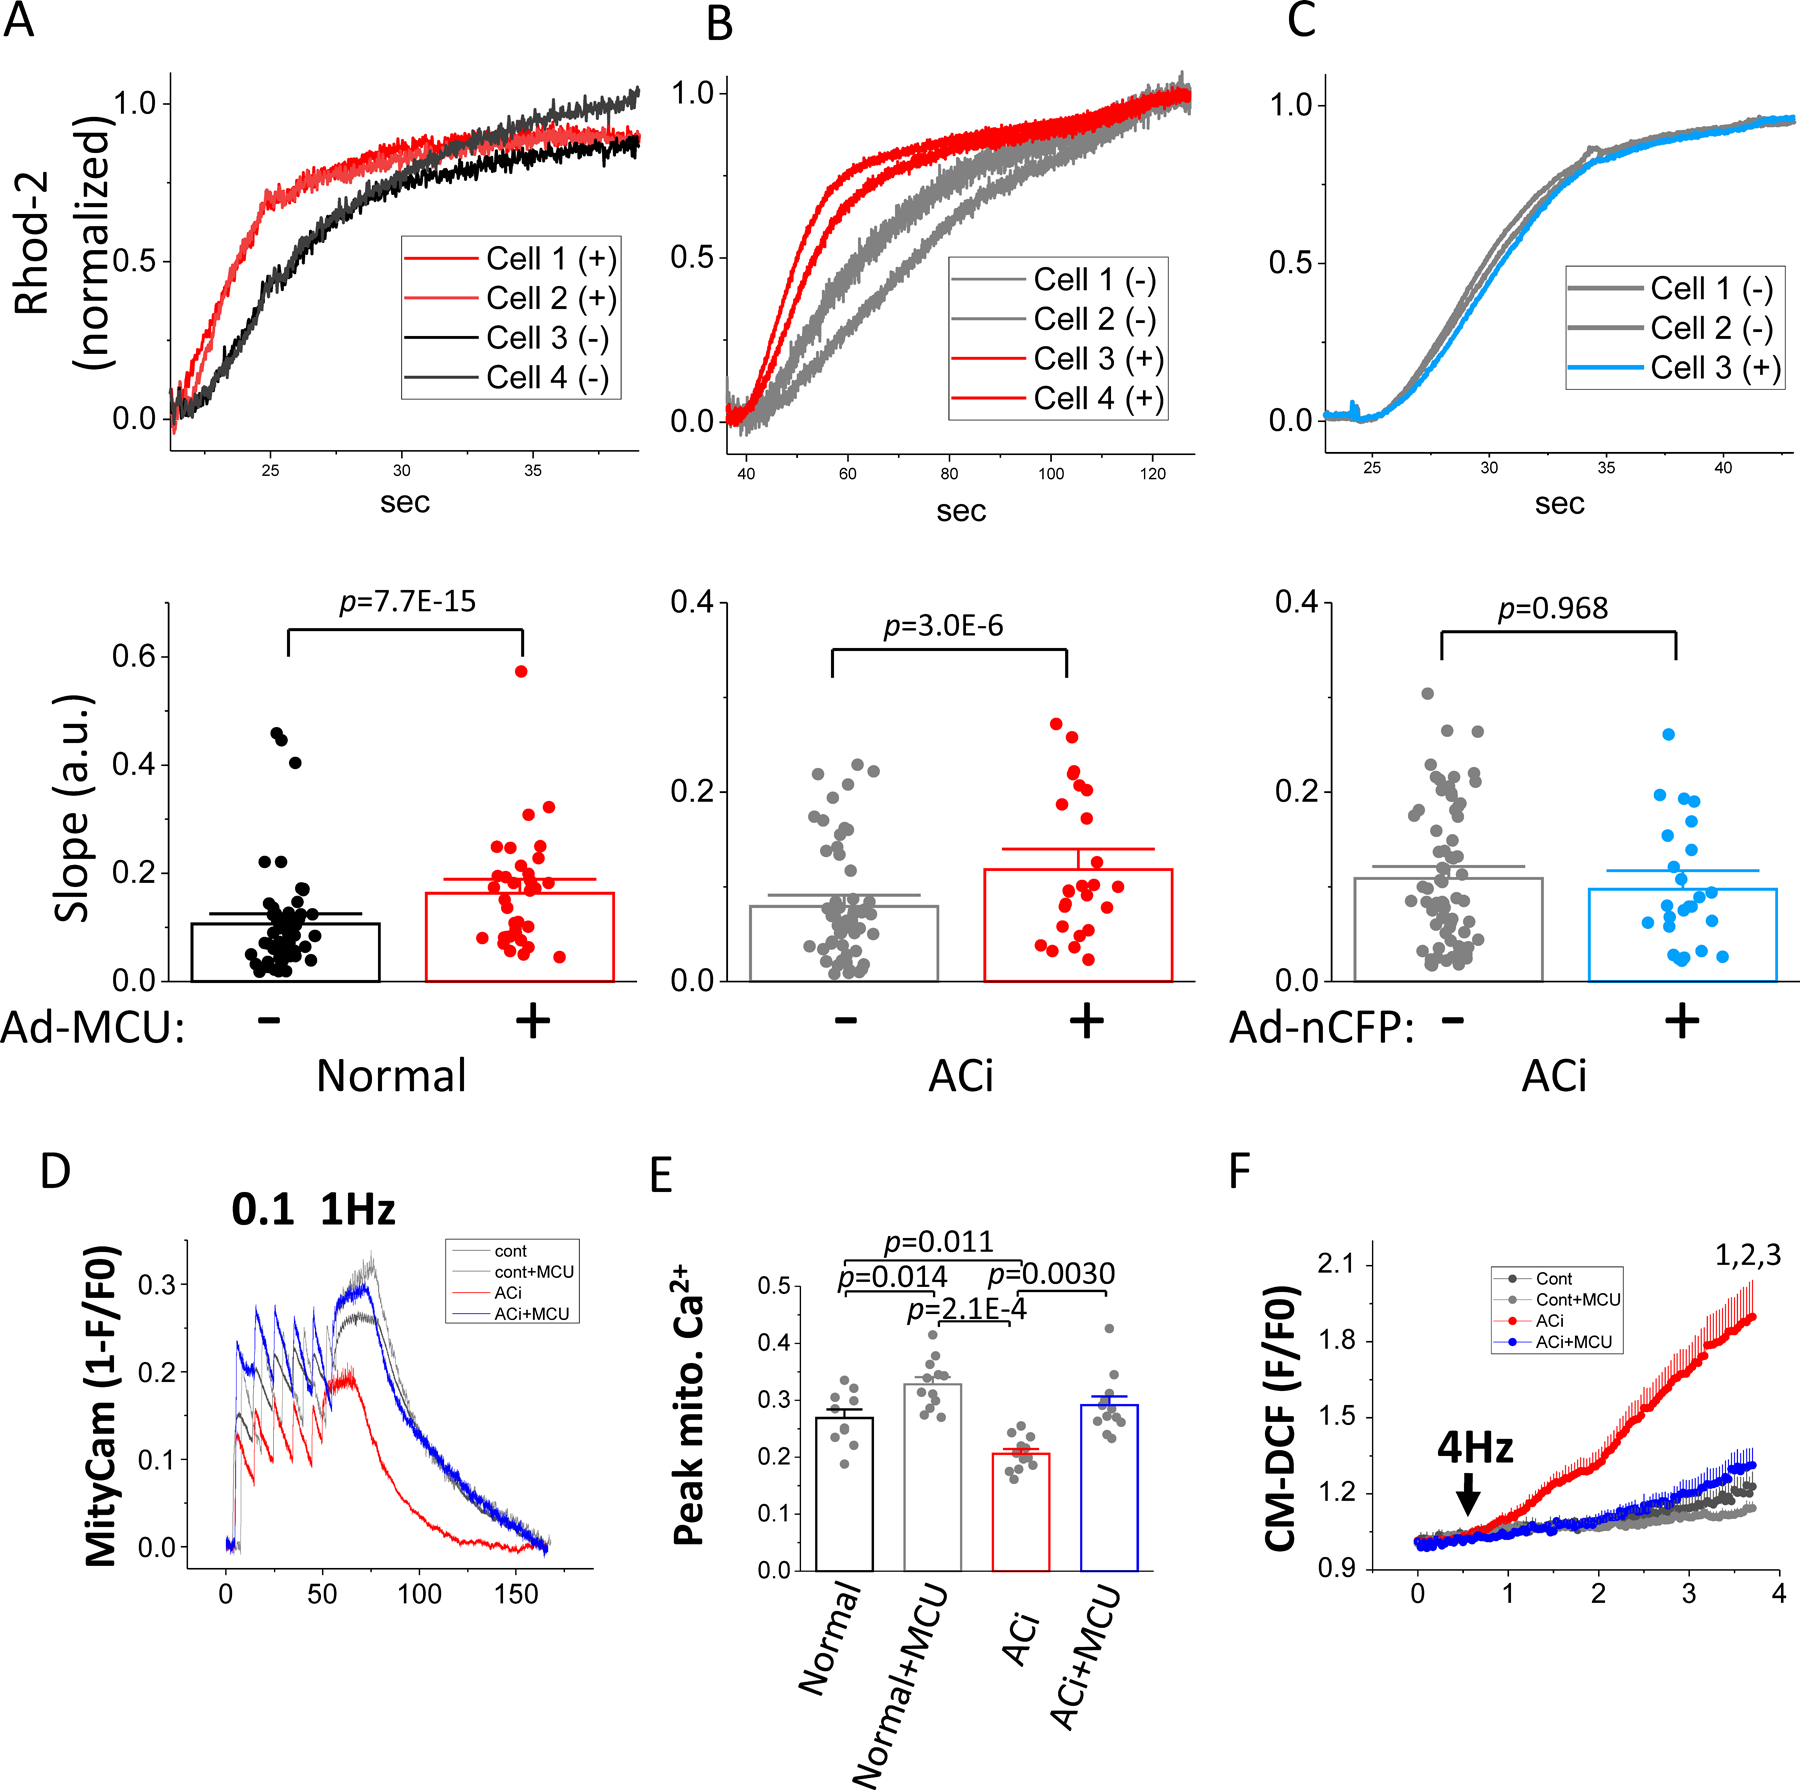
Figure 2. MCU overexpression increases the rate of mCa2+ uptake and restores mCa2+ accumulation and inhibits oxidative stress in failing cardiomyocytes.

A-C) mCa2+ uptake was recorded in permeabilized myocytes from normal (A) and ACi (B and C) hearts injected with Ad-MCU-flag-nCFP (A and B) or control virus (Ad-nCFP) (C). Upper panels: representative trace of rhod-2 signals simultaneously recorded in 4 cells (transduced, (+) and non-transduced (−)) from each group. The raw signal was normalized to a scale of 0 to 1. The transmitted light and nCFP images and rhod-2 time-lapse recordings of these representative cells are shown in Online Figure III. Lower panels: slope of the initial linear increase in rhod-2 fluorescence measured in both transduced and non-transduced cells was pairwise compared using nested random effects model (Normal: n=56 for non-transduced cells and 35 transduced cells; ACi+MCU: n=57 non-transduced cells and 26 transduced cells; ACi+nCFP: n= 73 for non-transduced cells and 25 for transduced cells; cells in each group were isolated from 3 hearts). D) mCa2+ accumulation was measured in freshly isolated myocytes after in vivo viral transduction with MityCam. Representative MityCam signals (1-F/F0) were recorded from resting state to 0.1 Hz and 1Hz stimulation in the presence of 100nM ISO in myocytes from Normal, Normal+MCU, ACi, and ACi+MCU groups. E) Averaged steady state MityCam signal at 1Hz stimulation in myocyte from Normal (n=10 from 3 hearts), Normal+MCU (n=12, from 4 hearts), ACi (n=12 from 4 hearts), and ACi+MCU (n=12, from 4 hearts) groups showing increased mCa2+ accumulation with MCU overexpression in Normal+MCU and ACi+MCU (right). Data were analyzed with nested 2-way ANOVA followed with post-hoc Tukey test. F) Myocytes isolated from Normal, Normal+MCU, ACi, and ACi+MCU groups (n=8 from 3 hearts in each group) were loaded with dihydrodichlorofluorescein (DCF) and stimulated at 4 Hz (arrow) in the presence of 100nM ISO for 3 min. Data were analyzed with nested 2 way-ANOVA with repeated measure followed with post-hoc Tukey test. 1, p=0.020; 2, p=0.016; 3, p=0.032 compared to Normal, Normal+MCU, and ACi+MCU groups, respectively.
