
FIGURE 1. CD-derived AIEC induces intestinal Th17 cells and inflammation in a pduC-dependent manner.
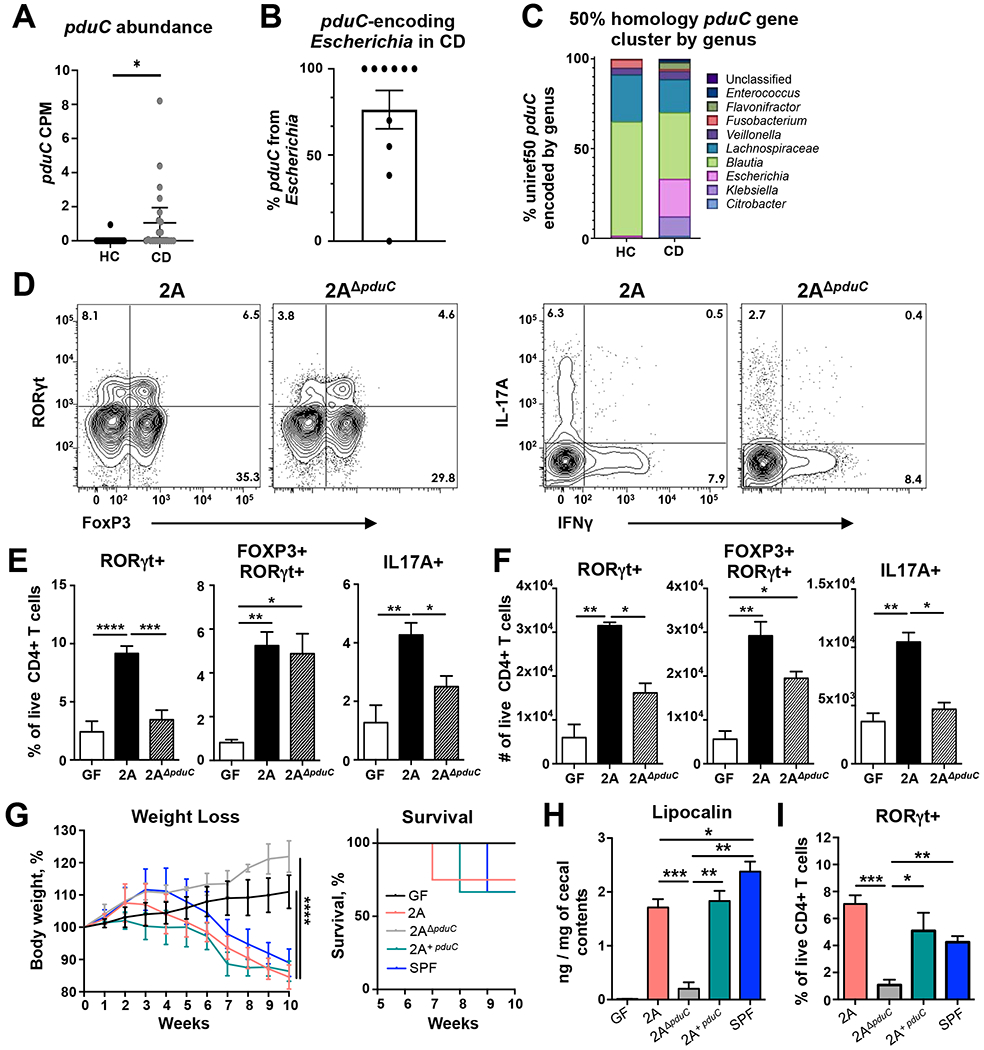
A. Read counts per million (CPM) base pairs of pduC in metagenomic sequencing from healthy controls (HC, N=24) compared to Crohn’s disease (CD, N=22). Error bars represent SEM. *p<0.05, unpaired t-test. B. Percentage of pduC reads encoded by the Escherichia genus. C. Average percentage of pduC reads by genus based on 50% homology for HC and CD patients. D-F. Germ-free C57BL/6 mice were colonized with 2×10⁹ CFU of CD-derived, AIEC 2A or pduC-deficient isogenic mutant (2AΔpduC) and analyzed after 15 days. Representative flow cytometry of live, CD4+ T cells was used to evaluate RORγt/FoxP3 and IL17/IFNγ expression following a 4h stimulation with PMA/ionomycin and Brefeldin-A (D). Percentage (E) and total numbers (F) of colonic RORγt+, RORγt+FOXP3+ and IL17A+ producing CD4+ T cells was evaluated. Bar graphs represent geometric mean of 6-8 mice per group from two of four total experiments. Error bars represent SEM. *p<0.05, **p<0.01, ***p<0.005, ****p<0.001 ANOVA. G-I. Germ-free Rag1-deficient mice were colonized with 2×10⁹ CFU of AIEC 2A, 2AΔpduC or complement 2AΔpduC+pduC. One week after colonization, mice received 500,000 FACS-sorted, naïve CD4+ T cells intraperitoneally. Mice were monitored for weight loss and survival (G) for 10 weeks. Levels of lipocalin in cecal contents was measured by ELISA at 10 weeks (H). Percentage of colonic RORγt+ CD4+ T cells was evaluated by flow cytometry (I). Graphs represent geometric mean of at least 3 mice per group from one of three experiments. Error bars represent SEM. *p<0.05, **p<0.01, ***p<0.005 ANOVA. See also Figures S1–S3.