
FIGURE 5. AIEC-derived propionate regulates MNP production IL-1β production.
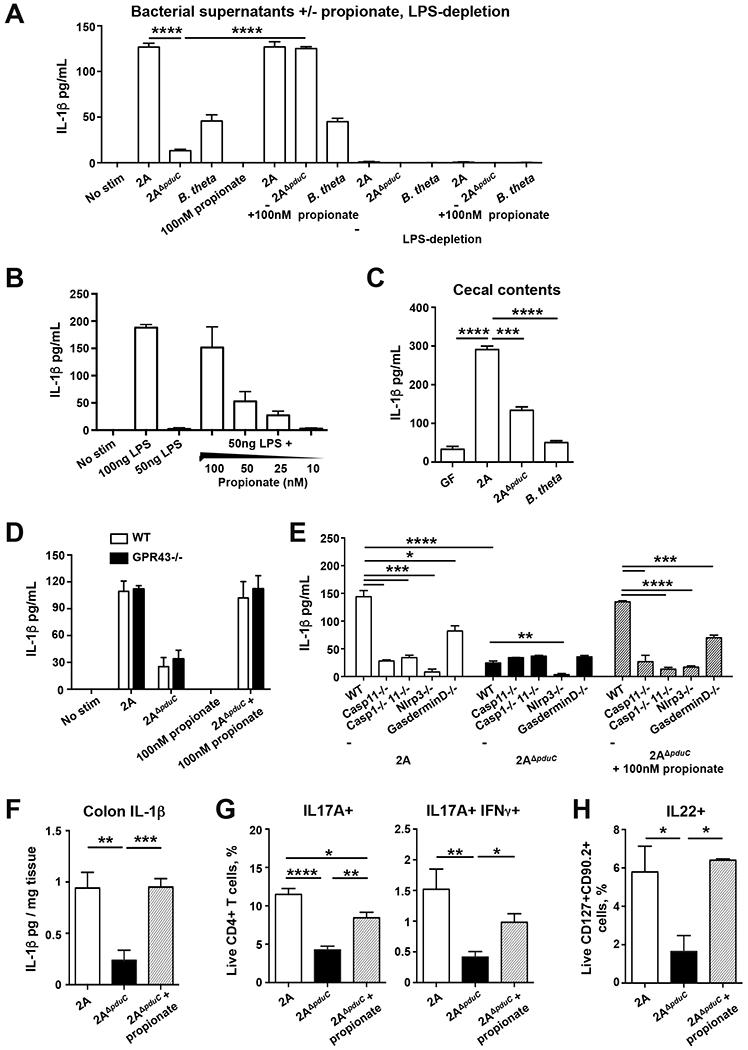
A-B. AIEC 2A or 2AΔpduC were grown anaerobically in M9-minimal media containing 20 mM L-fucose as the sole carbon source for 72 hours. BMDM were stimulated for 16h with cell-free supernatants and LPS-depleted supernatants in the presence or absence of 100nM propionate and IL-1β production was measured by ELISA (A). BMDM were stimulated with 50ng LPS along with decreasing concentrations of propionate to measure IL-1β induction (B). Graphs show at least 3 samples per group from one of four total experiments. Error bars represent SEM. *p<0.05, **p<0.01, ***p<0.005, ****p<0.001 ANOVA. C. BMDM were stimulated with cecal filtrates of monocolonized mice for 16h to measure IL-1β induction. Graphs show at 4 samples per group from one of two total experiments. Error bars represent SEM. ***p<0.005, ****p<0.001 ANOVA. D, E. Cell-free supernatants in the presence or absence of 100nM propionate were used to stimulate bone marrow-derived wild-type and GPR43-deficient macrophages (D) or immortalized WT, Caspase 11-, Caspase1/11-, Nlrp3- and Gasdermin D-deficient macrophages (E) for 16h. IL-1β production was measured by ELISA. Graphs show at least 4 samples from one of three total experiments. Error bars represent SEM. *p<0.05, **p<0.01, ***p=0.005, ****p=0.001, ANOVA. F-H. Germ-free Il10-deficient mice were colonized with 2×10⁹ CFU AIEC 2A or pduC-deficient isogenic mutant (2AΔpduC) for 7 days. A subset of 2AΔpduC-colonized mice were treated with 150nM of propionate jn the drinking water starting one day before colonization. IL-1β production was measured in colon explants cultured overnight (F). Percentage of colonic IL17A+ and IL-17+/IFNγ+ producing CD4+ T cells (G) and IL-22-producing ILC3s (H) was evaluated following a 4h stimulation with PMA/ionomycin with Brefeldin-A. Graphs show 7-8 samples from two pooled experiments. Error bars represent SEM. *p<0.05, **p<0.01, ***p=0.005, ****p=0.001, ANOVA. See also Figure S5.