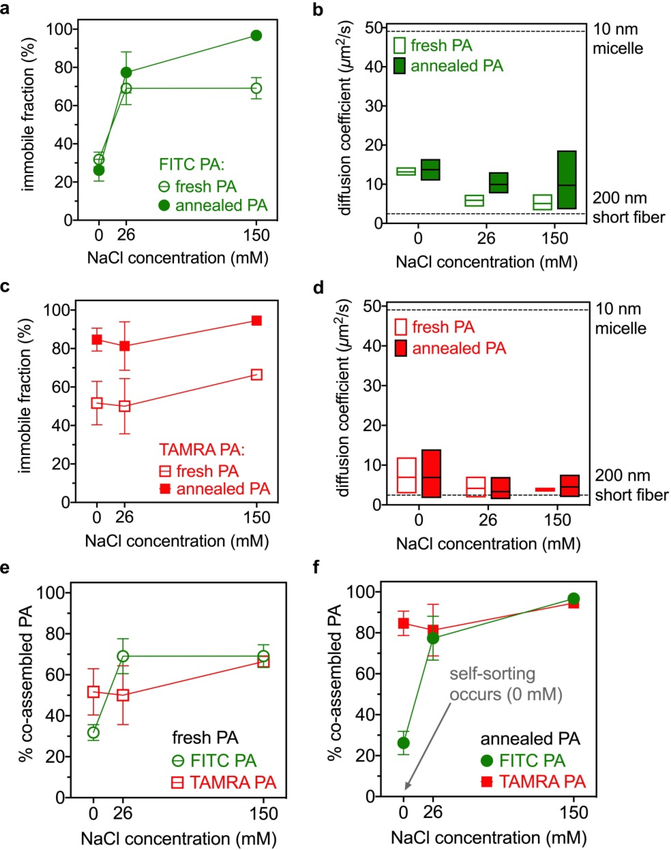
Figure 5.
(a) Immobile fraction of FITC PA when mixed with diluent PA and (b) diffusion coefficient of mobile FITC PA, at indicated conditions (the dashed lines are hypothetical values). (c) Immobile fraction of TAMRA PA when mixed with diluent PA and (d) diffusion coefficient of mobile TAMRA PA at indicated conditions (the dashed lines are hypothetical values). To compare FITC PA with TAMRA PA, the same data in panels a-d are plotted again to group (e) fresh and (f) annealed samples together.

