Figure 1.
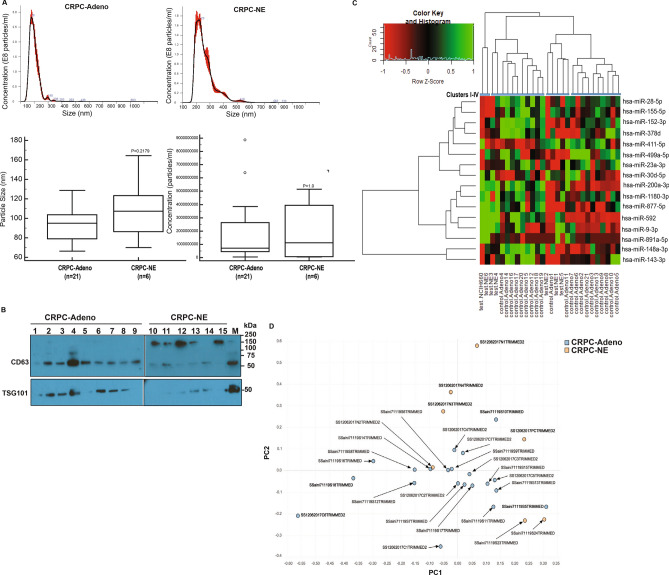
miRNA profiling of exosomes/EVs isolated from sera of CRPC-adenocarcinoma and CRPC-NE (treatment-induced) cases. (A) Representative NTA analyses for CRPC-Adeno (upper left panel) and CRPC-NE case (upper right panel). Particle size (left) and concentration (right) in CRPC-Adeno and CRPC-NE cases as determined by NTA analyses. (B) Western blot analyses for indicated exosomal markers in CRPC-Adeno and CRPC-NE cases. Samples 1–9 and 10–15 were run on two separate gels, with the partitioning indicated by solid black line. Samples derive from the same experiment and gels/blots were processed in parallel. Since CD63 and TSG101 fall in same size range, Western blots were initially probed with CD63 antibody. Following stripping, blots were re-probed with TSG101 antibody. (C) Heat map showing differentially expressed mature EV miRNAs in CRPC-adeno cases (n = 21) as compared to CRPC-NE (n = 6) cases. Heat map was generated by using R studio software, Version 1.1.463 (https://www.npackd.org/p/rstudio/1.1.463). Clusters (I-IV) are denoted by blue bars. (D) PCA plot showing EV-miRNA profiles in CRPC-Adeno and CRPC-NE cases.

