Figure 5.
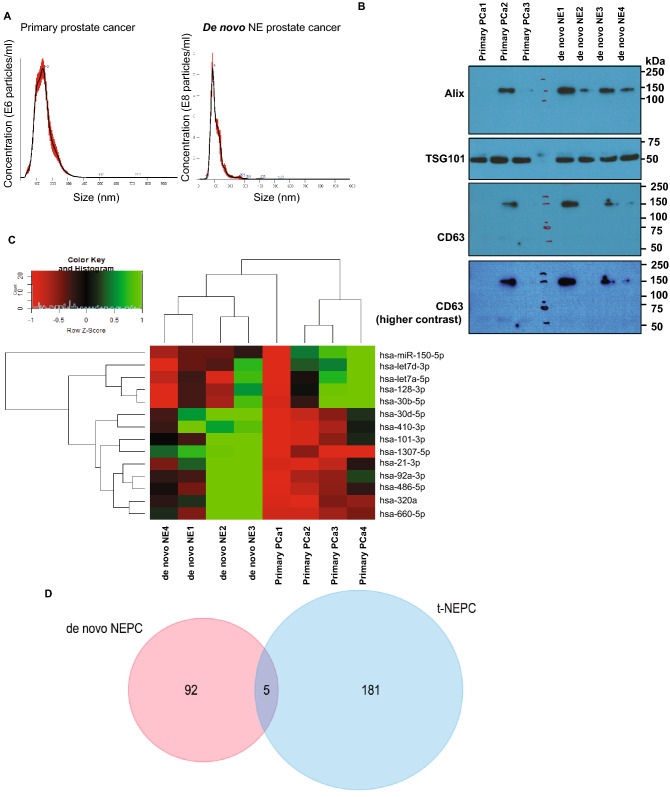
EV-miRNA profiling of de novo NEPC shows distinct miRNA alterations from treatment-induced NEPC. (A) Representative NTA analyses of EVs isolated from primary adenocarcinomas (left) and de novo NEPC (right). (B) Western blot analyses for exosomal markers in EVs isolated from primary adenocarcinomas and de novo NEPC. Following transfer of gel, blots were cut according to molecular weights. Upper parts of blots were probed with Alix antibody and lower parts were probed with TSG101 antibody. Since CD63 and TSG101 fall in same size range, following stripping, blots were re-probed with CD63 antibody. (C) Heat map showing differentially expressed miRNAs in EVs from de novo NEPC patients and those with primary adenocarcinomas. Heat map was generated by using R studio software, Version 1.1.463 (https://www.npackd.org/p/rstudio/1.1.463). (D) Venn diagram showing miRNA altered significantly in de novo NEPC vs treatment induced NEPC.

