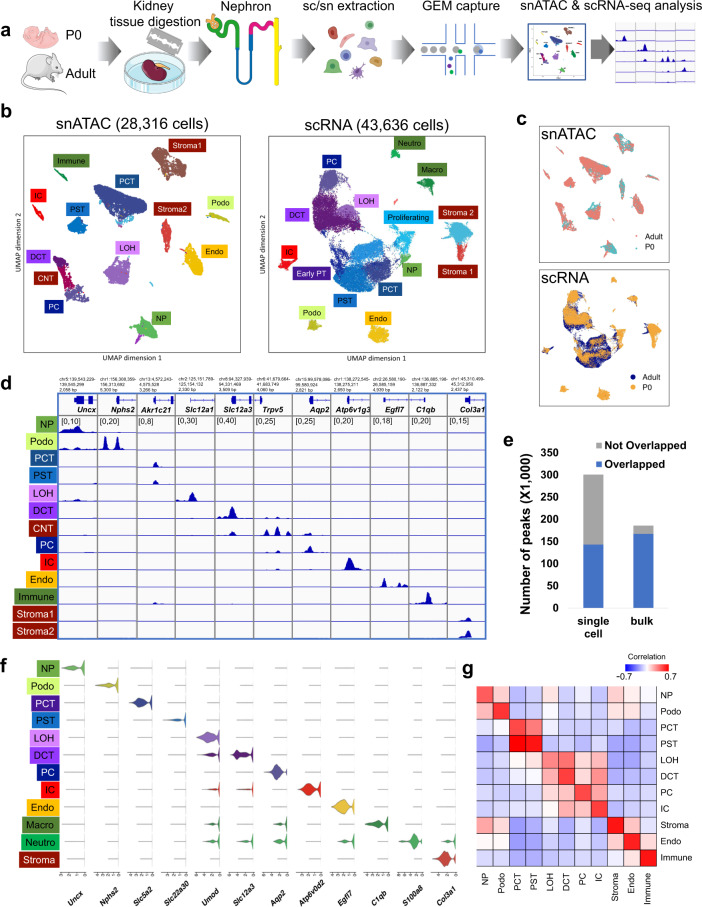
Fig. 1. snATAC-seq and scRNA-seq identified major cell types in developing and adult mouse kidney.
a Schematics of the study design. Kidneys from P0 and adult mice were processed for snATAC-seq and scRNA-seq followed by data processing and analysis including cell type identification and peak calling; artwork own production and from https://smart.servier.com, license https://creativecommons.org/licenses/by-sa/3.0/). b UMAP embeddings of snATAC-seq data and scRNA-seq data. Using marker genes, cells were annotated into nephron progenitors (NP), collecting duct intercalated cells (IC), collecting duct principal cells (PC), proximal convoluted and straight tubule (PCT and PST), loop of Henle (LOH), distal convoluted tubules (DCT), stromal cells (Stroma), podocytes (Podo), endothelial cells (Endo), and immune cells (Immune). In scRNA-seq data, the same cell types were identified, with an additional proliferative population and immune cells were clustered into neutrophils and macrophages. c UMAP embeddings of snATAC-seq and scRNA-seq data colored by P0 and adult batches. d Genome browser view of read density in each snATAC-seq cluster at cell type marker gene transcription start sites. Additional marker gene examples are shown in Supplementary Fig. 3a. e Comparison of peaks identified from snATAC-seq data and bulk ATAC-seq data. Peaks that are identified in both datasets are colored blue, and peaks that are dataset-specific are gray. f Violin plots showing cell type-specific gene expression in scRNA-seq data. g Heatmap showing Pearson’s correlation coefficients between snATAC-seq gene activity scores and gene expression values in P0 data. Each row represents a cell type in scRNA-seq data and each column represents a cell type in snATAC-seq data. The correlation of the adult dataset is shown in Supplementary Fig. 3b.

