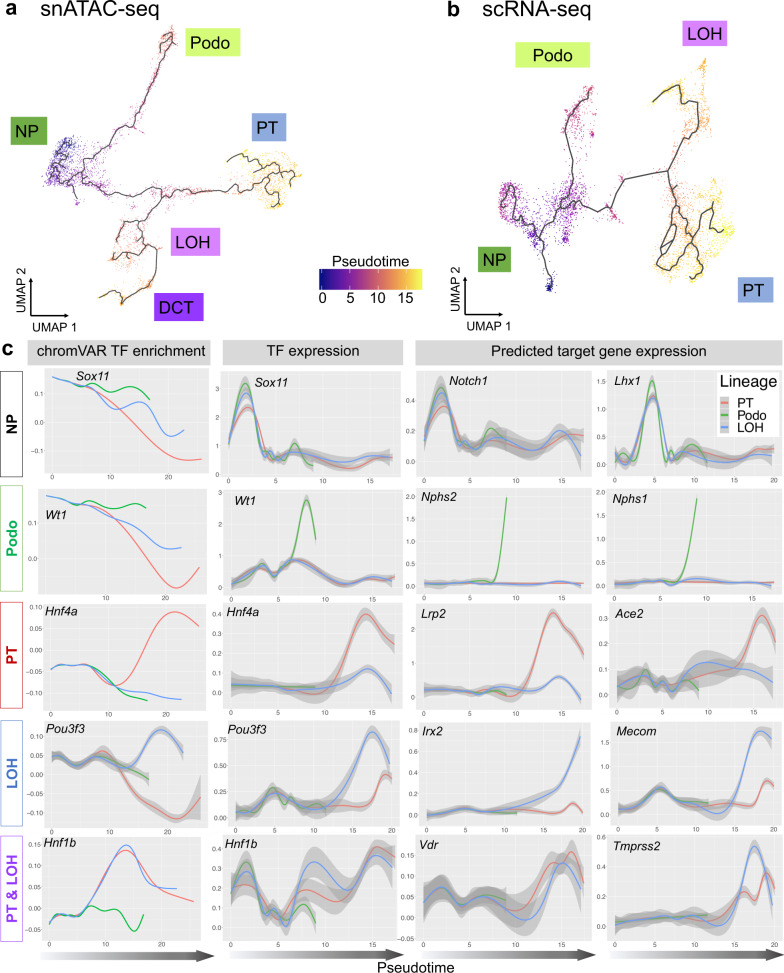
Fig. 3. The cellular trajectory of nephron progenitor differentiation.
a UMAP representation of snATAC-seq nephron progenitor differentiation trajectory towards podocytes, proximal tubule, loop of Henle and distal convoluted tubule, respectively, as inferred by Cicero. Cells are colored by pseudotime. b UMAP representation of scRNA-seq nephron progenitor differentiation trajectory towards podocytes, proximal tubule and loop of Henle, respectively, as inferred by Monocle3. Cells are colored by pseudotime. c Pseudotime-dependent chromatin accessibility and gene expression changes along the proximal tubule (red), podocyte (green), and loop of Henle (blue) cell lineages. The first column shows the dynamics of chromVAR TF enrichment score, the second column shows the dynamics of TF gene expression values and the third and fourth column represent the dynamics of SCENIC-reported target gene expression values of corresponding TFs, respectively. Error bars denote 95% confidence intervals of local polynomial regression fitting. Additional examples are given in Supplementary Fig. 18b.

