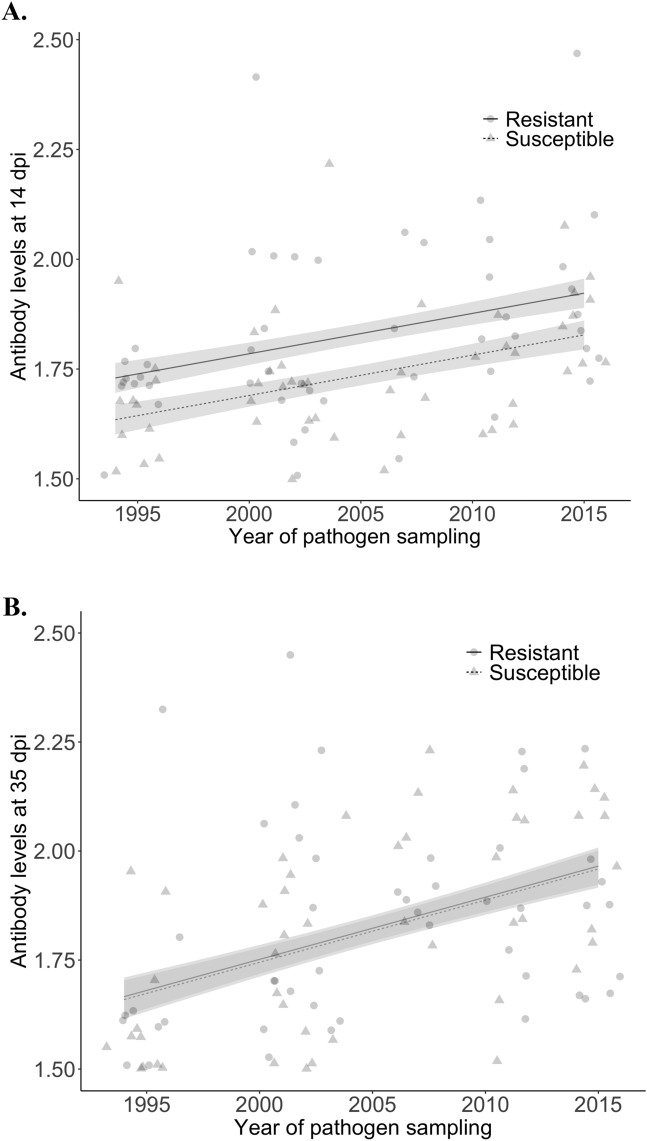
Figure 2.
Association between antibody levels (in EU/ml), year of pathogen sampling (1994–2017) and host population (resistant and susceptible) at (A) 14 dpi, and (B) 35 dpi (statistics provided in Table 2). Points represent raw values; lines are predicted from the model (solid = resistant host populations; dashed = susceptible host populations), with standard errors represented by ribbons. Note that points were jittered for clarity.

