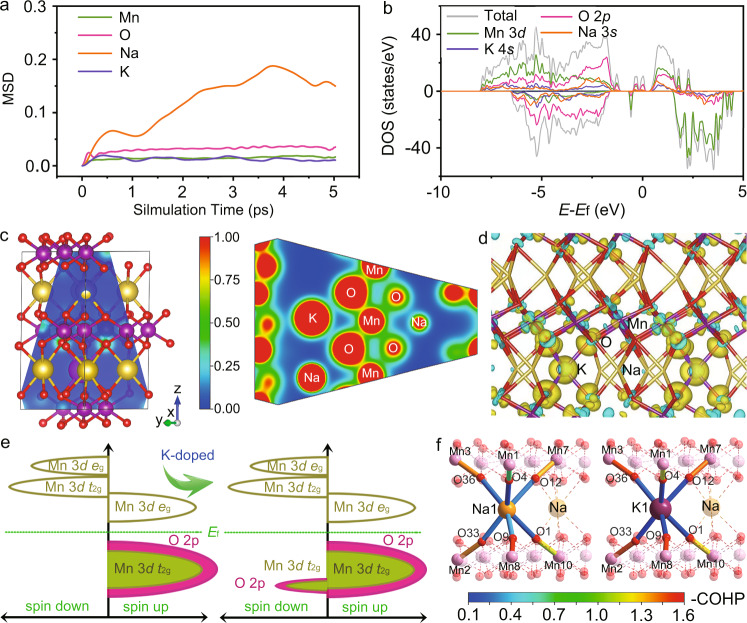
Fig. 5. Simulated atomic and electronic structures.
a MSD of Mn, K, Na, and O as functions of time in Na0.500K0.055MnO2. b Total density of states (tDOS) of Na0.220K0.055MnO2 and partial density of states (pDOS) of Na 3 s, K 4 s, O 2p and Mn 3d orbitals, as labeled by yellow, purple, red and green, respectively. The Fermi energy (Ef) is set to 0 eV, and the pDOS of Na 3 s, K 4 s are enlarged by 100 times. c Partial charge density distribution along the blue plane in the left panel for Na0.500K0.055MnO2 (visualized by Visualization for Electronic and Structure Analysis (VESTA)). The red regions represent high charge density, and the blue regions indicate low charge density. d Plot of deformation charge densities of Na0.500K0.055MnO2. The charge accumulation region is rendered in yellow, and the charge depletion is in blue. e Schematic pDOS of Na0.555MnO2 and Na0.500K0.055MnO2. f COHP analysis on representative prismatic sites and the adjacent MnO6-octahedra sites of Na0.555MnO2 and Na0.500K0.055MnO2.

