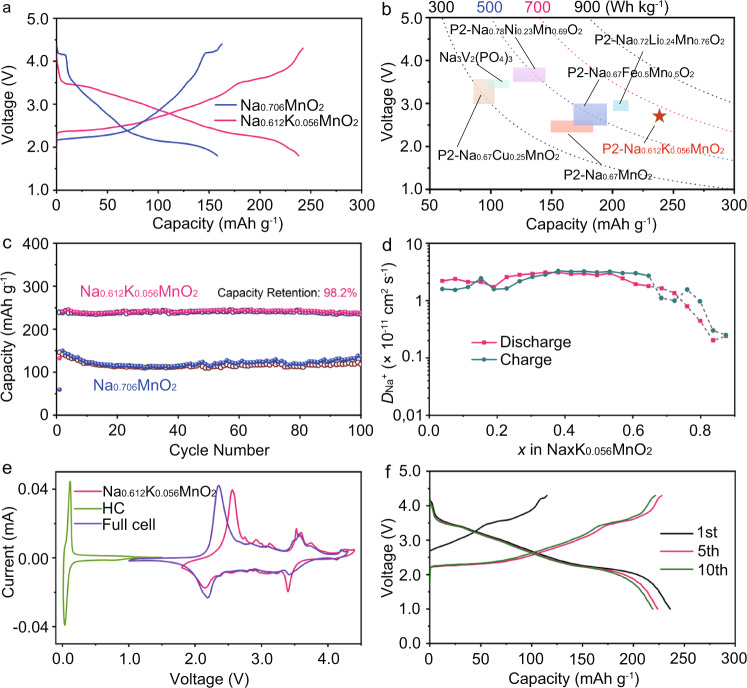
Fig. 6. Electrochemical performance.
a Typical charge/discharge curves of Na0.612K0.056MnO2 and Na0.706MnO2 at 20 mA g−1 in the third cycle. b Comparison of energy density and average voltages of Na0.612K0.056MnO2 with typical cathode materials in refs. 38–45. c Cycle performance of Na0.612K0.056MnO2 and Na0.706MnO2 at 50 mA g−1. d Variation of DNa + as functions of x in NaxK0.056MnO2 determined by GITT and CV, where the gray dotted area represents the two-phase region. e CV curves of Na0.612K0.056MnO2, HC and the full battery of HC//Na0.612K0.056MnO2 at 0.1 mV s−1. f Typical charge/discharge curves of HC//Na0.612K0.056MnO2 at 50 mA g−1.

