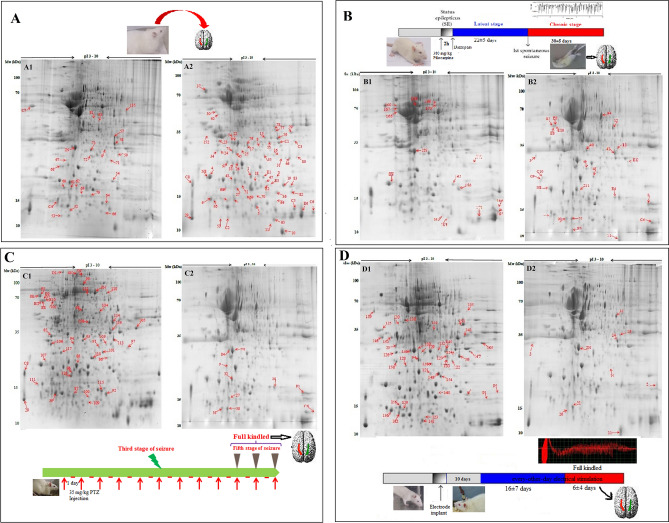
Figure 1.
2-DE analysis of the hippocampus proteome. The timeline of both control and epileptic tissue sampling is shown in each panel. One milligram of total proteins of each sample was separated by 2-DE on a pH 3–10 linear IPG strip in the first dimension and on a 12.5% SDS–PAGE gel in the second dimension. Representative gels from control tissues were showed in (A): the left (A1) and the right hippocampus (A2); panel (B) is related to pilocarpine model: the left (B1) and the right hippocampus (B2); panel (C) showed gels related to PTZ kindling model: The left (C1) and the right hippocampus (C2) and panel (D) showed proteome profile of left (D1) and right (D2) hippocampus related to electrical kindling model. Differently expressed spots were analyzed by ImageMaster 2D Platinum v7.0 and showed by arrows.

