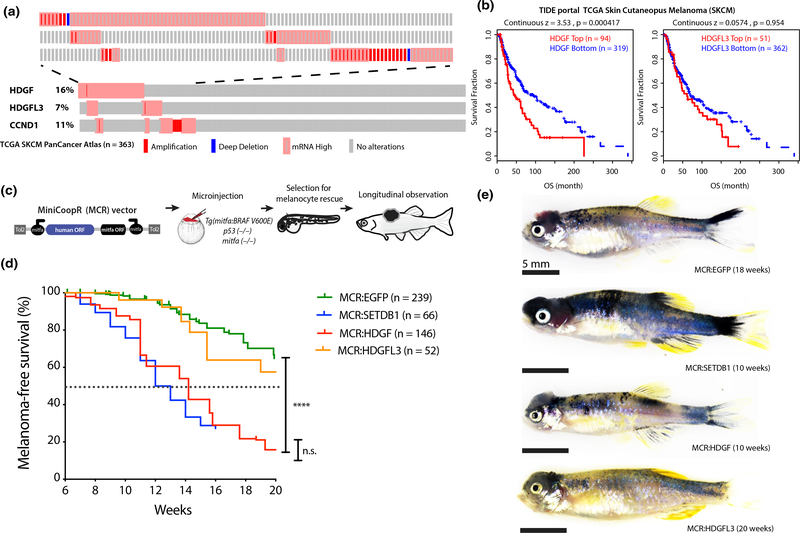
FIGURE 1.
Frequent amplification or overexpression of HDGF correlates with poor prognosis in melanoma patients and accelerates melanoma in a zebrafish transgenic model. (a) Oncoprint of HDGF, HDGFL3 and commonly amplified gene CCND1 in TCGA skin cutaneous melanoma dataset showing copy number changes and mRNA expression (Z score > 2) compared to diploid samples. Mutations are not shown and no patient had evidence of “mRNA low.” Each individual rectangle represents a patient. The top part of the figure is a close-up of altered patients. (b) Correlation of mRNA expression of HDGF and HDGFL3, with Overall survival in TCGA skin cutaneous melanoma dataset from TIDE portal. This analysis identifies the Z expression threshold resulting in maximal curve separation (logRank Mantel-Cox p) across the two groups. For bottom versus top quartile, see Figure S1b–c. (c) Schematic of in vivo MCR experimental design (top) and (d) Kaplan–Meier survival curve (bottom) showing the tumor onset of MCR vectors microinjected in Tg(mitfa:BRAFV600E);tp53-/-;mitfa-/- to drive melanocyte-specific expression of HDGF (red) or HDGFL3 (orange), EGFP (green) and SETDB1 (blue) (****=p < .0001) (logRank Mantel-Cox p). Median onset is indicated by the dotted line. (e) Representative image of the gross anatomy of a tumor-bearing fish. Bright field image, all scale bars are 5mm. Pigmented raised melanoma tumors are visible on the head region of each fish

