FIGURE 2.
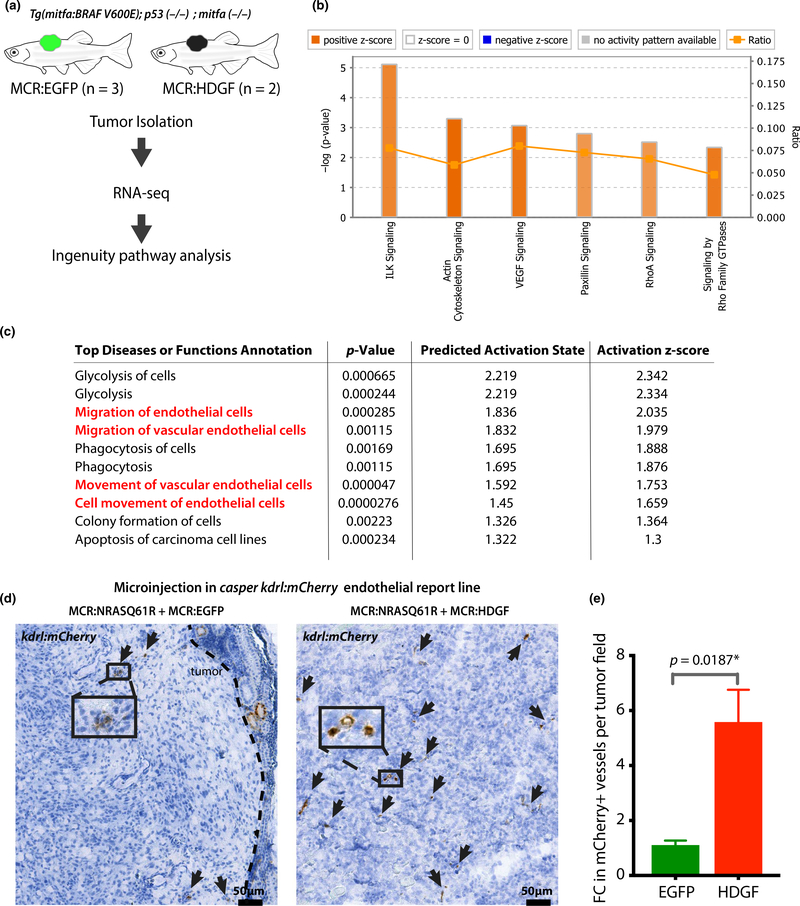
HDGF increases angiogenesis. (a) Outline of RNA isolation and transcriptional analysis in MCR:EGFP and MCR:HDGF mitfa:BRAFV600E;tp53-/--driven tumors. (b) Ingenuity pathway analysis (IPA) showing the most significant activated pathways (Z score > 2) in HDGF tumors compared to EGFP tumor controls. Color intensity corresponds to Z score value (i.e., darker orange, larger Z score). (c) IPA analysis showing the most significantly activated diseases or function annotations in MCR:HDGF tumors compared to MCR:EGFP controls. Terms relating to endothelial cell migration/angiogenesis are highlighted in red. (d) Analysis of the effect of HDGF on tumor vasculature in the MCR:NRASQ61R model. MCR:EGFP or MCR:HDGF was co-injected with MCR:NRASQ61R into one cell stage casper embryos carrying the krdl:mCherry transgenic vasculature reporter line. 8- to 10-week-old tumor-bearing zebrafish were fixed and subjected to anti-mCherry immunohistochemistry using DAB (brown). Slides were bleached to remove melanin pigment interference. A representative image per genotype is shown. The brown signal in the tumor (mCherry) represents vasculature and is highlighted with arrows. (E) Quantification of DAB mCherry + vessels in 4 MCR:EGFP and 5 MCR:HDGF tumors (multiple fields of view/tumor, at 20x). A total of 22 fields were analyzed. The number of vessels per field was averaged per animal, and fold change (FC) was calculated by normalizing over the average of EGFP controls and analyzed via unpaired t test

