FIGURE 3.
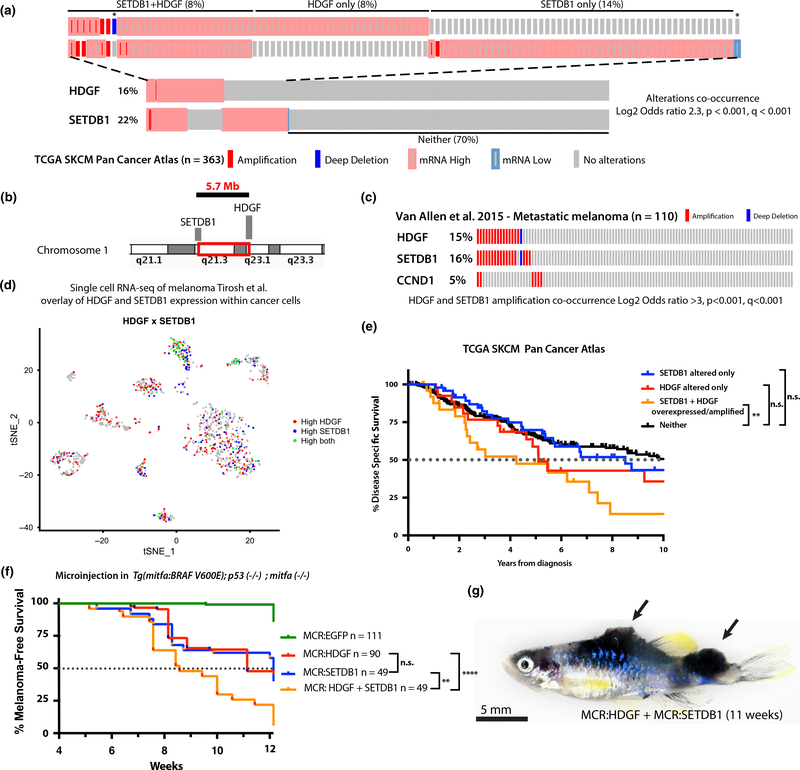
HDGF and SETB1 frequent co-amplification or overexpression correlates with poor prognosis in melanoma patients and strongly accelerates melanoma in a zebrafish transgenic model. (a) Oncoprint of HDGF and SETDB1 in TCGA skin cutaneous melanoma dataset (Liu et al., 2018) showing significant co-occurrence of copy number changes and mRNA expression (Z score > 2). Mutations are not shown. The top part of the figure is a close-up of altered patients. Overall % prevalence in the cohort is reported for each group (SETDB1 + HDGF, HDGF only, SETDB1 only or neither). Each individual rectangle is a patient. Patients labeled with * were included in the neither group for survival analysis in 3E. (b) Illustration of the genomic localization and distance of HDGF and SETDB1 on chromosome 1. (c) Oncoprint of HDGF, SETDB1 and commonly amplified gene CCND1 in metastatic melanoma (Van Allen et al., 2015). (d) scRNA plot of metastatic melanoma (Tirosh et al., 2016) cancer cells showing co-expression of HDGF and SETDB1 at the single cell level in melanoma. Each cluster represents a patient, and only cancer cells are shown. (e) Kaplan–Meier disease-specific survival analysis of patients in Figure 1a (**p = .0099, n.s.= not significant) (logRank Mantel-Cox p). (f) Effect on tumor onset of MCR vectors microinjected into Tg(mitfa:BRAFV600E);tp53-/-;mitfa-/-. For HDGF + SETDB1, a pool of the two vectors (12.5pg + 12.5 pg of DNA) with the same total amount of plasmid DNA as the other conditions (25 pg) was injected. HDGF + SETDB1 versus SETDB1 p = .0013**, HDGF + SETDB1 versus HDGF p < .0001****, HDGF versus SETDB1 p = .25 (not significant), HDGF + SETDB1, HDGF, SETDB1 versus EGFP all p < .0001**** (logRank Mantel-Cox p). (g) Representative image of a MCR:HDGF + MCR:SETDB1 fish bearing multiple tumors. Bright field image, scale bar is 5 mm. Multiple pigmented raised melanoma tumors are visible on the dorsum and caudal peduncle regions and are marked by black arrows. See Figure S4f for quantification

