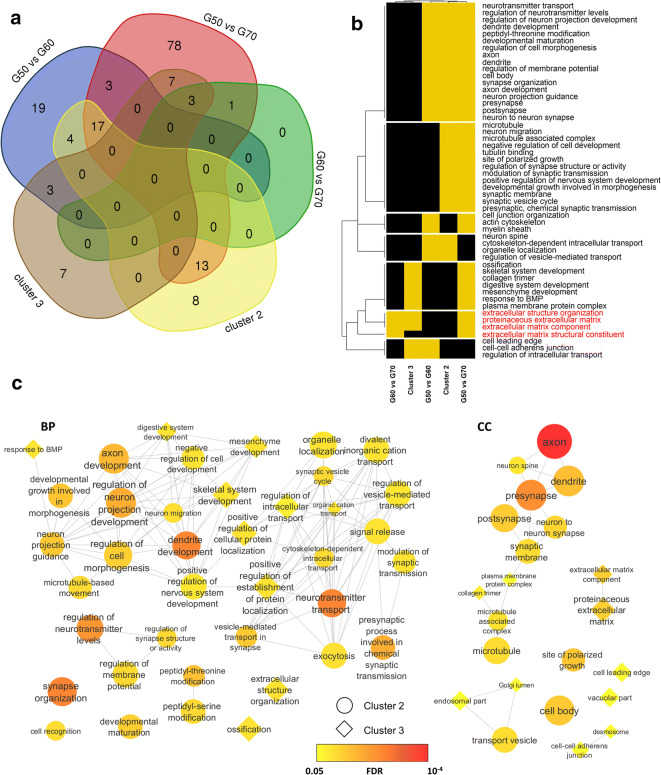
Fig. 3.
Enrichment analysis of GOs of differentially expressed genes (DEGs). a Venn diagram of GOs overrepresented in each analysis. b Heatmap of overlapping GOs in the analysis, rows represent GOs and columns represent specific analysis. Yellow color indicates that the GO is present in the specific analysis and black indicates the absence. c Similarity GO analysis. Each node or diamond represents a GO in Cluster 2 or 3, respectively. Sizes correspond to the number of genes observed in the category and FDR is scaled by color yellow to red according to the range of 0.05 to 10−4. Edges represent the similarity between the GOs

