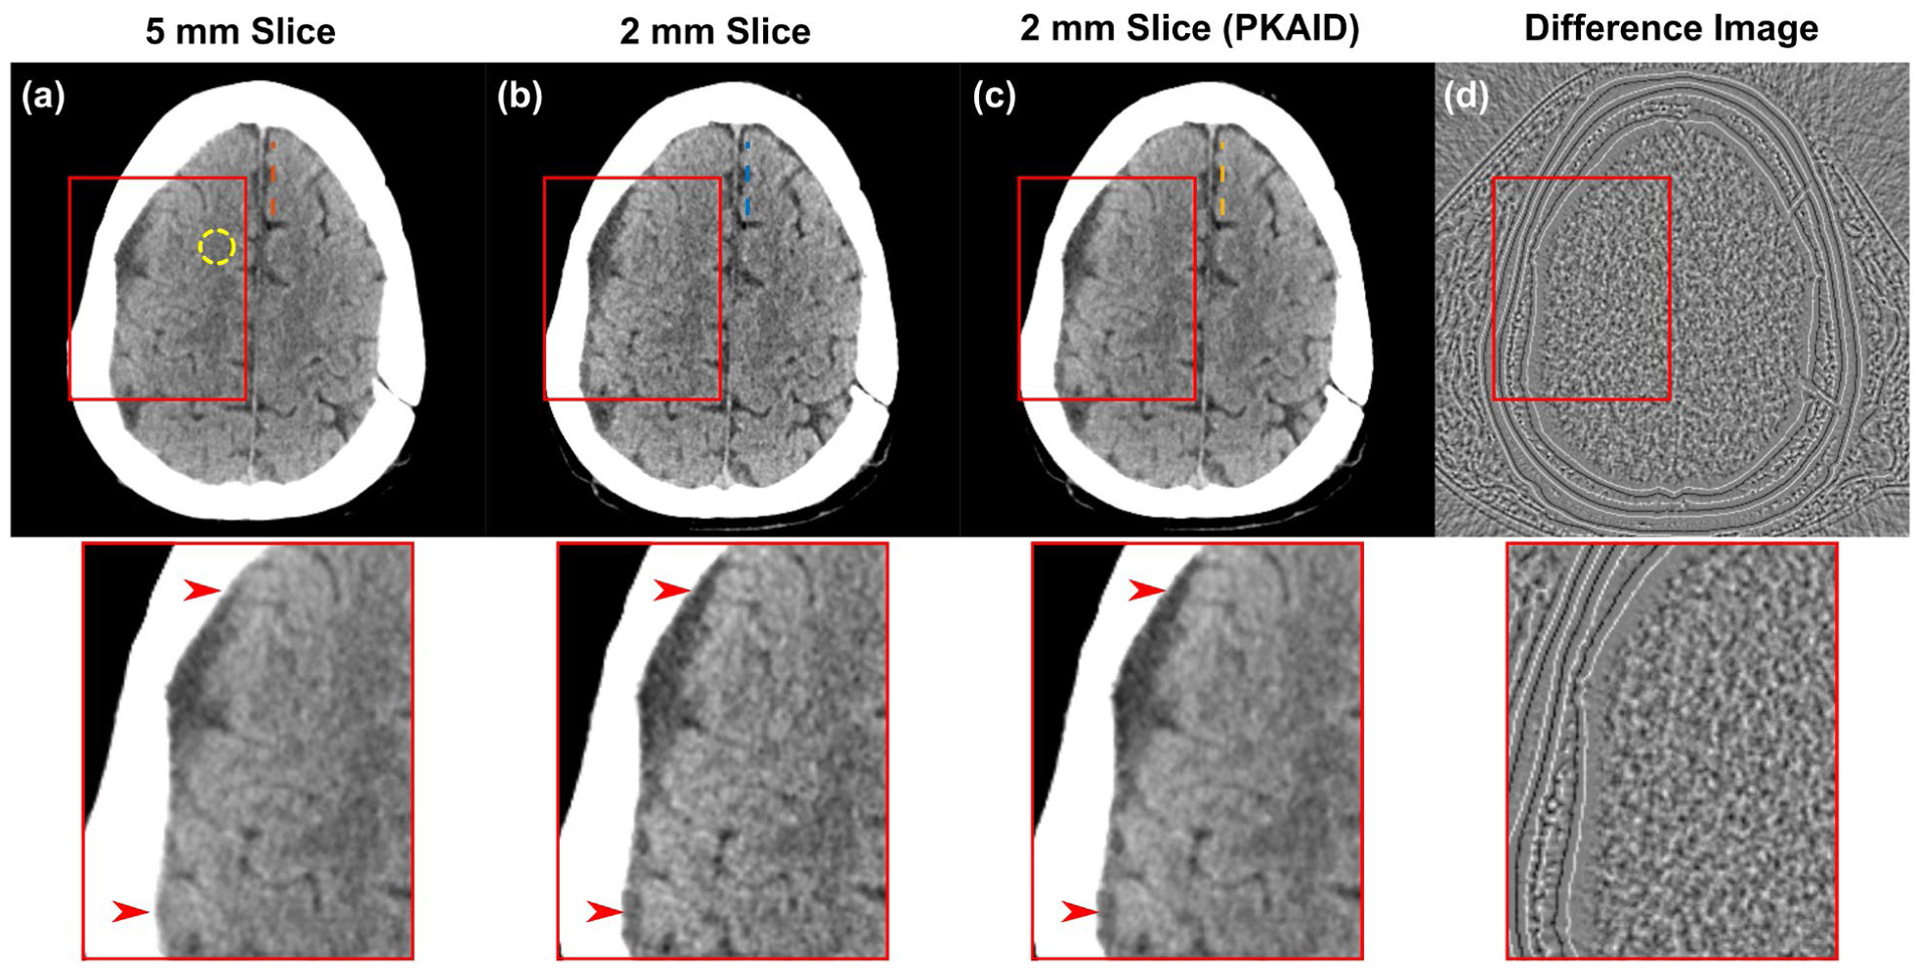
Figure 7:

Example of non-contrast head CT images acquired on patient 2. (a): images reconstructed with clinically used 5 mm slice thickness; (b): thin slice images with 2 mm thickness before denoising; (c): 2 mm thickness after PKAID; (d): difference image between the 2 mm images before and after denoising. Dashed circle in (a) shows the location of ROI used for noise evaluation. Dashed lines show the locations of line profiles in Figure 8. Window width/level (WW/WL) = 80/40 HU for the anatomical images, 20/0 HU for the difference image.
