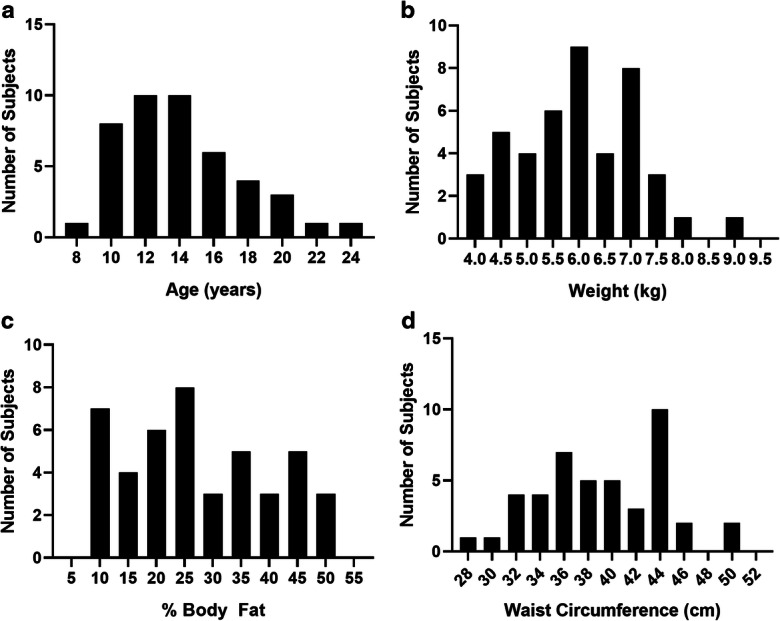
Fig. 1.

Frequency histograms depicting the non-human primate (NHP) cohort characteristics. a Age ranges were selected to represent adulthood through to the oldest. b Body weights. c Percentages of body fat as measured by computed tomography image analysis. d Waist circumferences were used to indicate obesity status of the cohort. Animals were selected to represent a wide range so as to enable examination of both an age- and weight-diverse group of NHPs. Bodyweight is an imperfect estimate for obesity; thus, we used additional screening measures to be sure a wide range was captured
