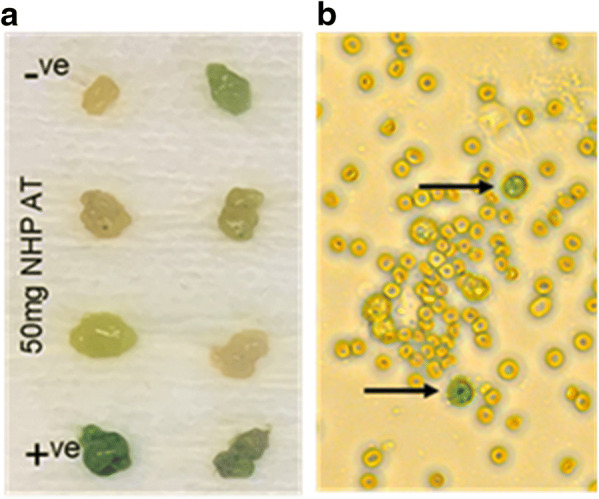
Fig. 2.

a Tissue staining and scoring. Tissues were scored by multiple blinded observers using a scale of 0–4. Tissue controls (positive, +; negative, −) were included to verify assay integrity. Negative staining resulted in a white/yellow adipose color and positive staining resulted in a dark blue color. b Cell staining: Single-cell isolates from whole adipose tissue were plated, stained, and images captured. Senescent cells, indicated by arrows, were deemed as positive due to whole cell staining with a blue color. Positive cells were counted manually by blinded observers, and an image analysis application was used to count total numbers of cells plated as the denominator used in calculating final percentages
