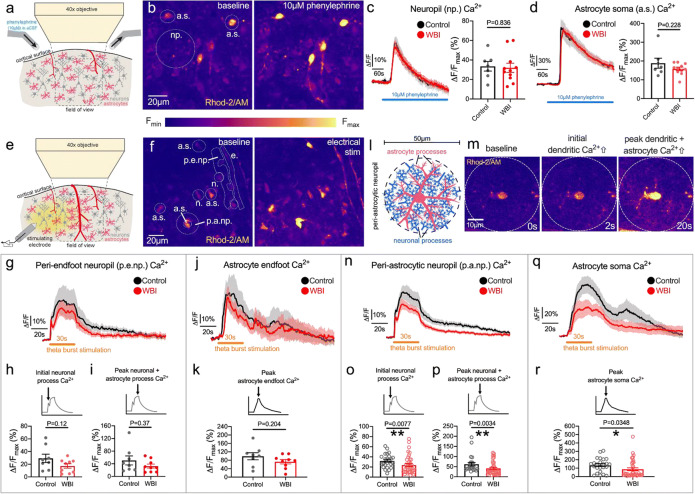
Fig. 3.
Effects of whole brain irradiation (WBI) on cortical astrocyte Ca2+ responses to phenylephrine and to electrical stimulation. a Schematic diagram of the experimental setup to image cortical astrocyte Ca2+ responses to topical phenylephrine (10 μM) application with fluorescent 2-photon microscopy. b Pseudocolored fluorescent 2-photon microscopy image of cortical astrocytes in layers 1 and 2 of the sensory-motor cortex preloaded with the synthetic Ca2+ indicator Rhod-2/AM before and at the peak of phenylephrine-induced Ca2+ elevation. Np.: neuropil, a.s.: astrocyte soma. c Neuropil Ca2+ changes during 10-μM phenylephrine application and peak Ca2+ responses of control (7 ROIs of 7 slices, 5 mice) and WBI animals (11 ROIs of 11 slices, 7 mice). ROI: region of interest. d Astrocyte soma Ca2+ changes during 10-μM phenylephrine application and peak Ca2+ responses of Control (40 cells, 7 slices, 5 mice) and WBI animals (67 cells, 11 slices, 7 mice). ROI; region of interest. ΔF/Fmax: maximum relative fluorescence from 60 s baseline. Unpaired t test. *P < 0.05. e Schematic diagram of the experimental setup to image cortical astrocyte Ca2+ responses to electrical stimulation with fluorescent 2-photon microscopy. f Pseudocolored fluorescent 2-photon microscopy image of cortical astrocytes in layers 1 and 2 of the sensory-motor cortex pre-loaded with the synthetic Ca2+ indicator Rhod-2/AM before (left image) and at the peak of electrical stimulation-evoked Ca2+ elevation (right image). A.s.: astrocyte soma, p.a.np.: peri-astrocytic neuropil, e: endfoot, p.e.np.: periendfoot neuropil, n: neuron soma. g Summary traces of the periendfoot neuropil Ca2+ changes during 30s theta burst stimulation in the WBI (red; 9 ROIs of 9 slices, 6 animals) and control (black; 8 ROIs of 8 slices, 6 animals) group (mean ± SEM). h Initial neuronal process Ca2+ response peak of the first 3 s of periendfoot neuropil Ca2+ elevation during 30 s theta burst stimulation (unpaired t test). i Peak neuronal process and astrocytic process Ca2+ elevation in the periendfoot neuropil in response to 30 s theta burst stimulation (Mann–Whitney U test). j Summary traces of astrocyte endfoot Ca2+ changes during 30 s theta burst stimulation in WBI (red; 9 ROIs of 9 slices, 6 mice) and Control (black; 8 ROIs of 8 slices, 6 mice) groups (mean ± SEM). k Endfoot Ca2+ transient peak elicited by 30 s theta burst stimulation (Mann–Whitney U test). l Schematic of the periastrocytic neuropil which contains astrocyte processes and neuronal processes. m Representative pseudocolored images of Rhod-2/AM fluorescence from an astrocyte and its periastrocytic neuropil area at baseline (0 s), 2 s, and 20 s after the onset of 30-s electrical stimulation. n Summary traces of the periastrocytic neuropil Ca2+ changes during 30-s theta burst stimulation in WBI (red; 38 ROIs, 9 slices, 6 animals) and in control mice (black; 24 ROIs, 8 slices, 6 animals) (mean ± SEM). o Peak of the initial neuronal process Ca2+ response during the first 3 s of periastrocytic neuropil Ca2+ elevation during 30 s theta burst stimulation (Mann–Whitney U test). p Peak neuronal process and astrocytic process Ca2+ elevation in the periastrocytic neuropil in response to 30 s theta burst stimulation (Mann–Whitney U test). q Summary traces of astrocyte soma Ca2+ changes during 30 s theta burst stimulation in WBI (red; 38 cells, 9 slices, 6 mice) and in control animals (black; 24 cells, 8 slices, 6 mice) (mean ± SEM). r Peak of astrocyte soma Ca2+ transients evoked by theta burst stimulation for 30 s in WBI (red) and control (black) groups (Mann–Whitney U test). ΔF/Fmax: maximum relative fluorescence increase from 10 s baseline. ROI: region of interest. *P < 0.05, **P < 0.01

