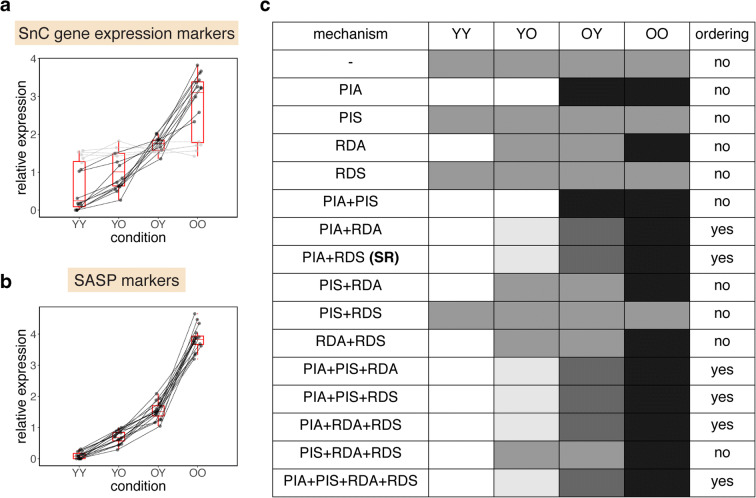
Fig. 2.
Order of senescent cell levels after parabiosis in old and young mice. A comparison of senescent cell abundance in young isochronic parabionts (YY), old isochronic parabionts (OO), young heterochronic parabionts (YO), and old heterochronic parabionts (OY). Senescent cell abundance was estimated by using gene expression markers (p16Ink4a and p21Cip1) (a) in the liver, kidney, lung, pancreas, forebrain, cerebellum, gastrocnemius, and heart, and SASP markers (Il1β, Il6, Mcp1, and Tnfα) (b) in the liver, kidney, lung, and forebrain. The results of each test are presented as a line which connects the results for each of the parabiosis groups. Tests where there is a significant difference between YY and OO (and are therefore indicative of senescent cell accumulation) are shown in black. Data is from Yousefzadeh et al. [36]. To normalize for differences in average expression between markers and tissues, each line was normalized to have mean = 1. c Predictions for the ordering of senescent cell levels for YY, YO, OY, and OO for all 16 mechanisms described in Fig. 1 (darker color corresponds to higher senescent cell levels). Only models where both production increases with age (mechanism PIA) and removal decreases with age or senescent cells (mechanisms RDA or RDS) result in YY < YO < OY < OO as observed

