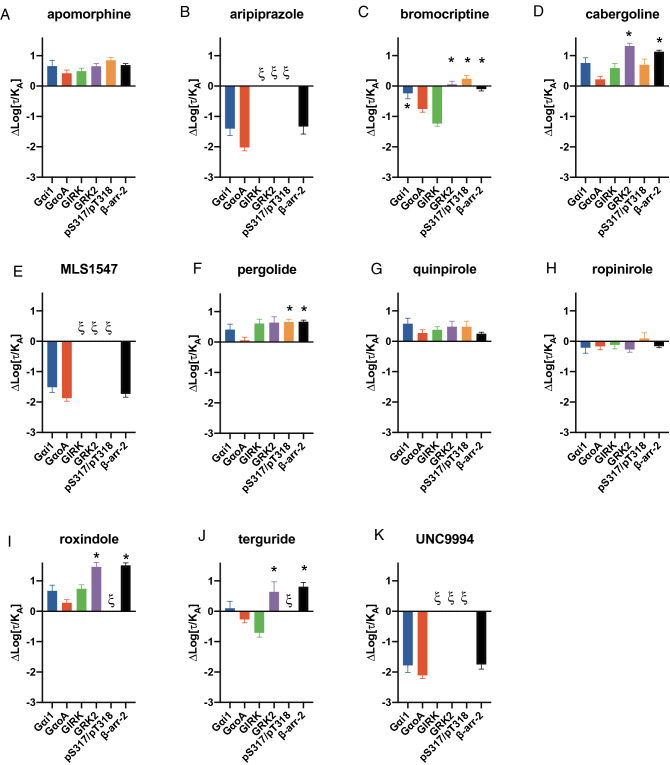
Figure 6.
Relative transduction coefficients (ΔLog(τ/KA)) for agonists to activate D2R pathways. Concentration–response curves for each endpoint were fit to an operational model of agonism to determine (Log(τ/KA)), this was normalized relative to dopamine to determine the relative transduction coefficient at each pathway (ΔLog(τ/KA), Supp. Table. 1). Analysis of ΔLog(τ/KA) values using a one-way ANOVA with Dunnet’s post hoc test revealed significant differences determined for each agonist in the Gαo assay as compared to that obtained in the other signaling and regulatory endpoints. * = P < 0.05. Data presented represents the mean ± S.E.M of at least 3 independent experiments (Supp. Table. 1). ξ denotes instances where agonist responses were not sufficiently robust to allow fitting of the operational model.

