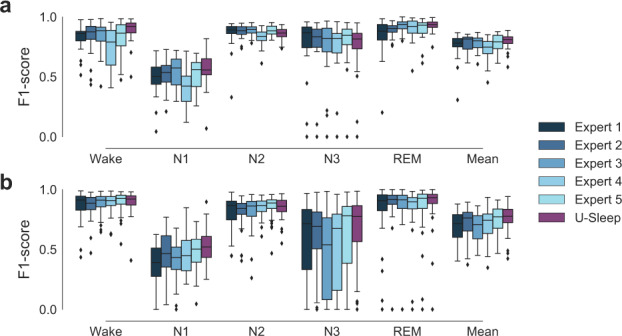
Fig. 3. Boxplots illustrating the distributions of F1 scores from 5 human experts and U-Sleep on healthy controls and OSA patients.

a Shows results from dataset DOD-H on 25 healthy subjects. b Shows results from dataset DOD-O on 55 patients suffering from OSA. Sleep stages produced by U-Sleep and the five individual experts were compared to consensus-scored hypnograms. Please refer to the Methods section for further details. Mean F1 scores averaged across stages are shown along with F1 scores for the five individual sleep/wake stages. The performance of U-Sleep is shown in red colors (right most boxplot in each group). The performance of each human expert is shown in shades of blue (4 left most boxplots in each group). Note that some records were scored by both human experts and U-Sleep with very low F1 scores (0 in some cases) on individual classes. This especially concerns stage N3 in dataset DOD-O and most often happens for rare classes. For instance, a patient severely affected by OSA rarely enters the N3 deep sleep stage, and the resulting low number of observed N3 stages makes even a few errors result in a large deviation in the F1 score. Each boxplot shows the median (middle vertical line), first and third quartiles (lower and upper box limits) and whiskers that extend to 1.5 times the IQR added or subtracted the third and first quartiles, respectively. Data outside of this range is marked as outliers indicated by diamond shaped points.
